I have written a number of articles on how to create memory dumps for troubleshooting W3WP process hangs, crashes or memory consumption issues.
- Create a memory dump when the W3WP process terminates using Procdump
- Creating a W3WP Memory dump on Windows Server 2003
- Creating a W3WP Memory dump on Windows Server 2008 R2
- Configure Debug Diagnostic 2.0 to create a memory dump when a specific exception is thrown
- Using Procdump and Failed Request Tracing to capture a memory dump
- How to capture a memory dump of a W3WP process that consumes too much CPU
- New ProcDump version 5.0 released, using the –f parameter
- Finding the W3WP worker process PID and associated ID
- Debugging a hung application with WinDbg
- Why does my !runaway command not work
- Create a memory dump for your slow performing Web App
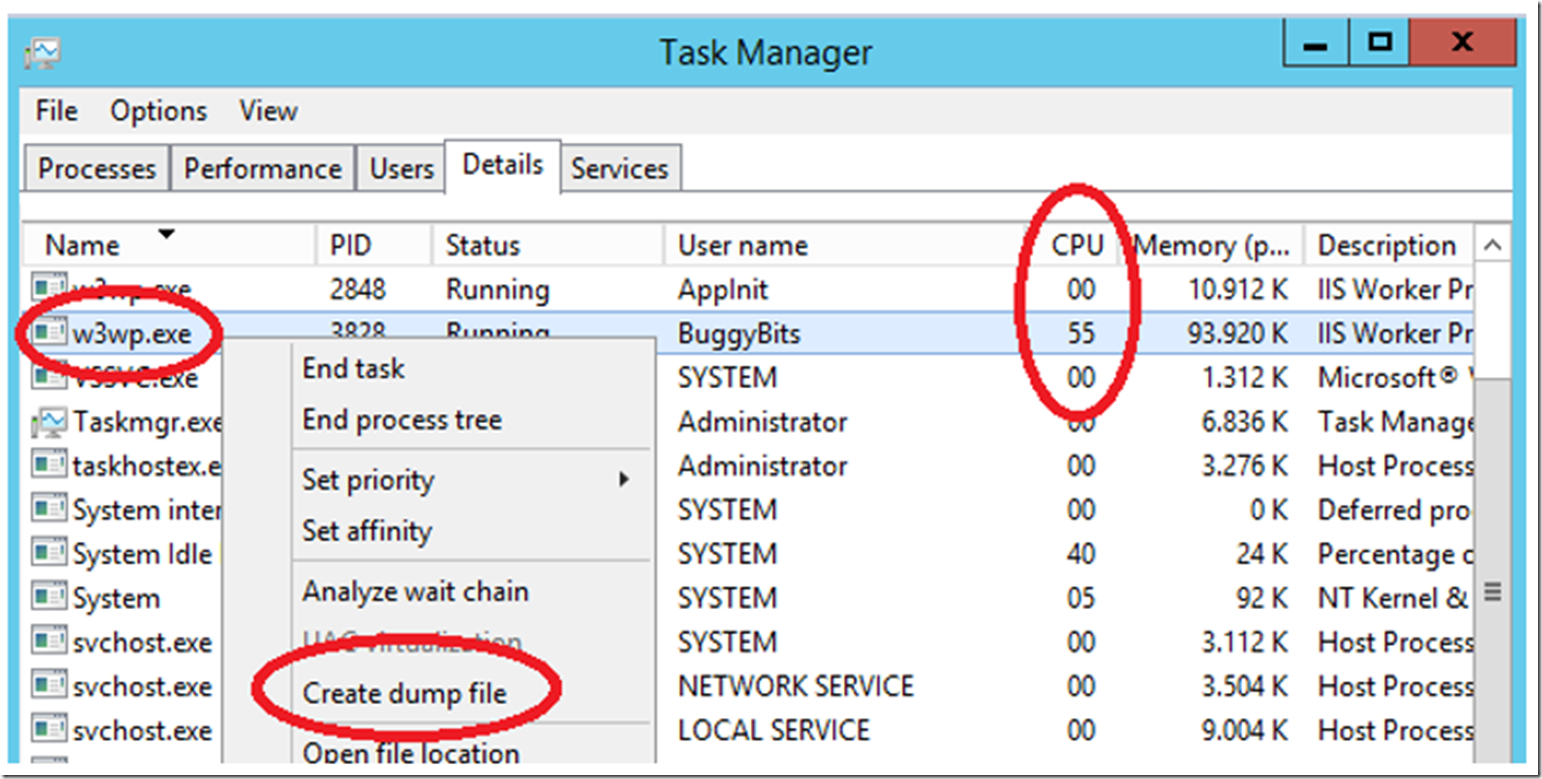
Those are all good techniques, IMO, but sometimes, I or you just need a quick and easy memory dump to either give to support or to analyze yourself. Again, IMO, this method is best for when CPU is 100% (or a high amount) or a request is hanging or taking some time to respond. In the first example, simply open the Task Manager, and when the CPU consumption for the W3WP process is higher than you would expect, right-click on the process, and select Create dump file, as shown in Figure 1.
Figure 1, get a memory dump quick, fast and easy
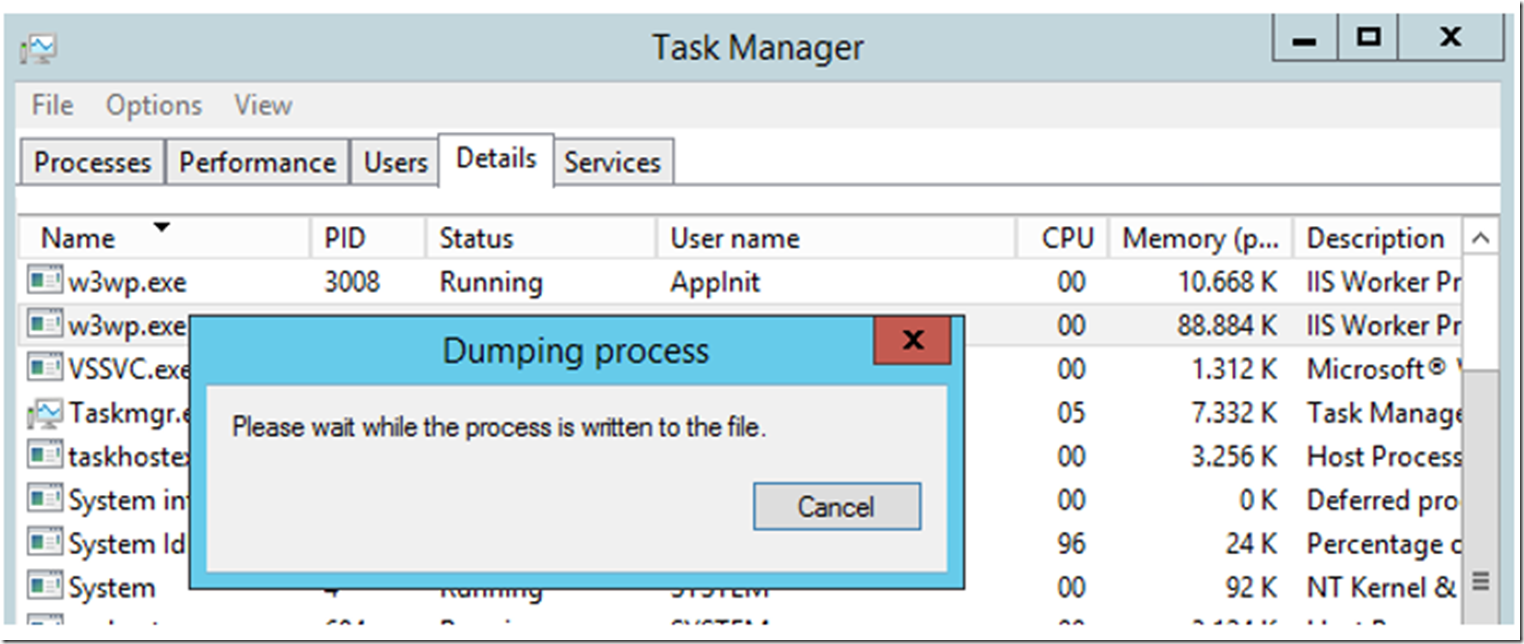
You should then see the following, while the memory dump is being created, Figure 2.
Figure 2, the process memory dump is being created
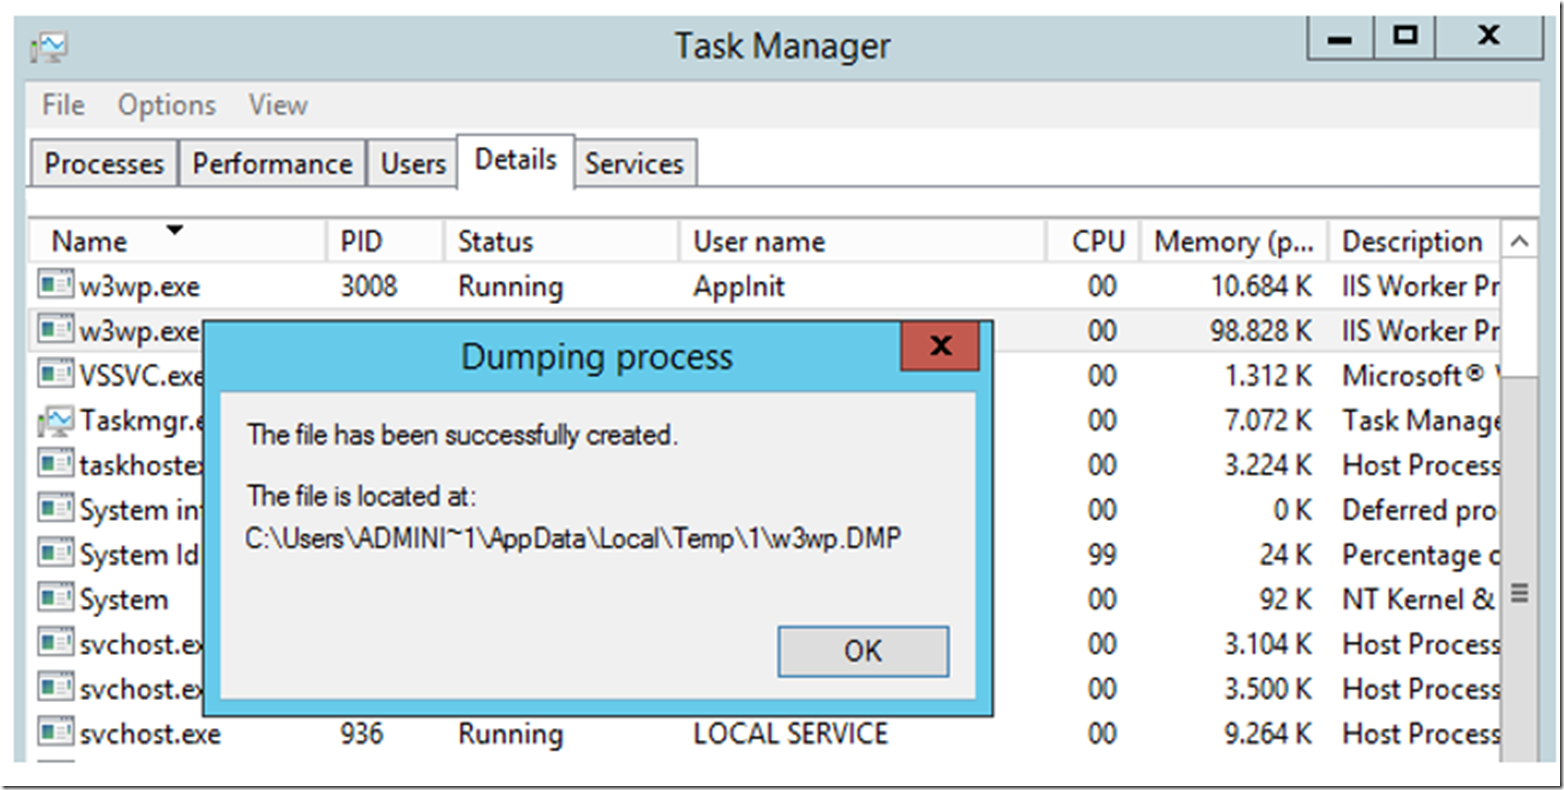
Then, as shown in Figure 3, once created the location of the DMP file is provided, so you can analyze it or send it on to support.
Figure 3, where the memory dump is written
The only difference between the capture of a memory dump for a process consuming too much CPU and a hang is that you need to make sure the hung request is running within the process when the memory dump is taken.
VERY IMPORTANT: The hanging request must be running in the process when the dump is taken
***I’ll mention that point again because it is very important. When you have a hung situation, make sure the request which is hanging is running within the process when the memory dump is taken. If this does not happen, then the memory dump would not contain the problem and would either waste some time or lead the person analyzing the dump to wrong conclusions and suggest non-applicable resolution paths/options.


