I have written an article here that explains how to install and configure Failed Request Tracing. Please use that for reference.
In this lab you will:
- Install the Failed Request Tracing (Tracing) role
- Configure Failed Request Tracing
- Capture and review the Failed Request Trace
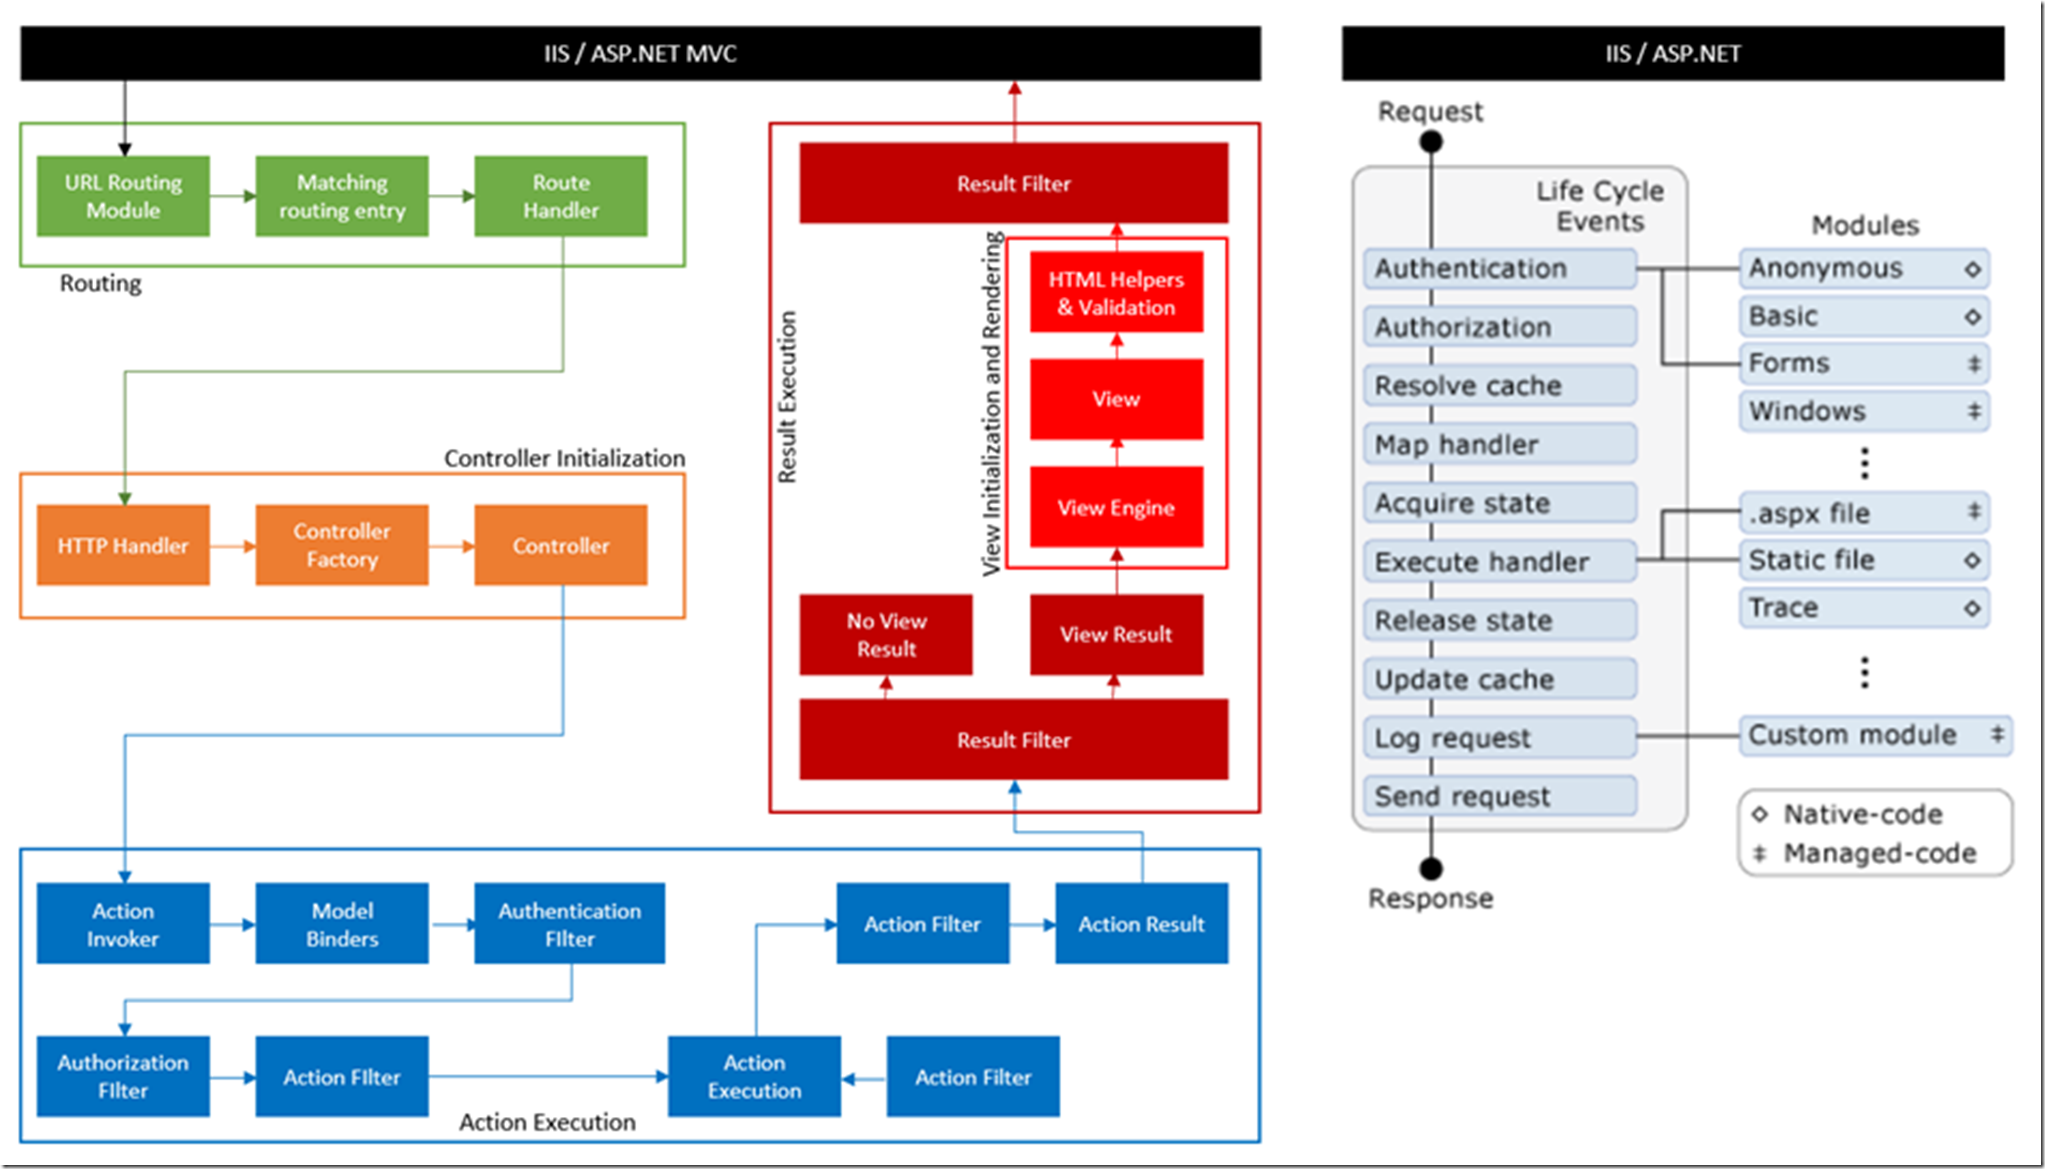
If you have not completed the previous labs, specifically Lab 2, then you need to download and configure the CSharpGuitarBugs website from here. NOTE: Failed Request Tracing are particularly good when troubleshooting general authentication and exceptions happening on an IIS server. For slow ASP.NET Webforms applications there are a lot of benefits for using FREB. However, for troubleshooting slow ASP.NET MVC web sites, see the bottom of the this lab for an example of tracing a slow request using PerfView. Basically, using FREB to trace a slow ASP.NET MVC request is not optimal because of different pipeline used for executing the MVC request, see the Figure 20 at the end of this article for an visual representation of the different request pipelines (ASP.NET MVC vs. ASP.NET pipeline). Similar for a PHP request, you would likely see that the request is handed over to the PHP_CGI.exe, but you would not see where in the PHP file the slowness was happening, for could use XDEBUG for that scenario, but it is not covered in this lab.
Install the Failed Request Tracing role
The article I wrote previously here is valid from IIS 7 until now.
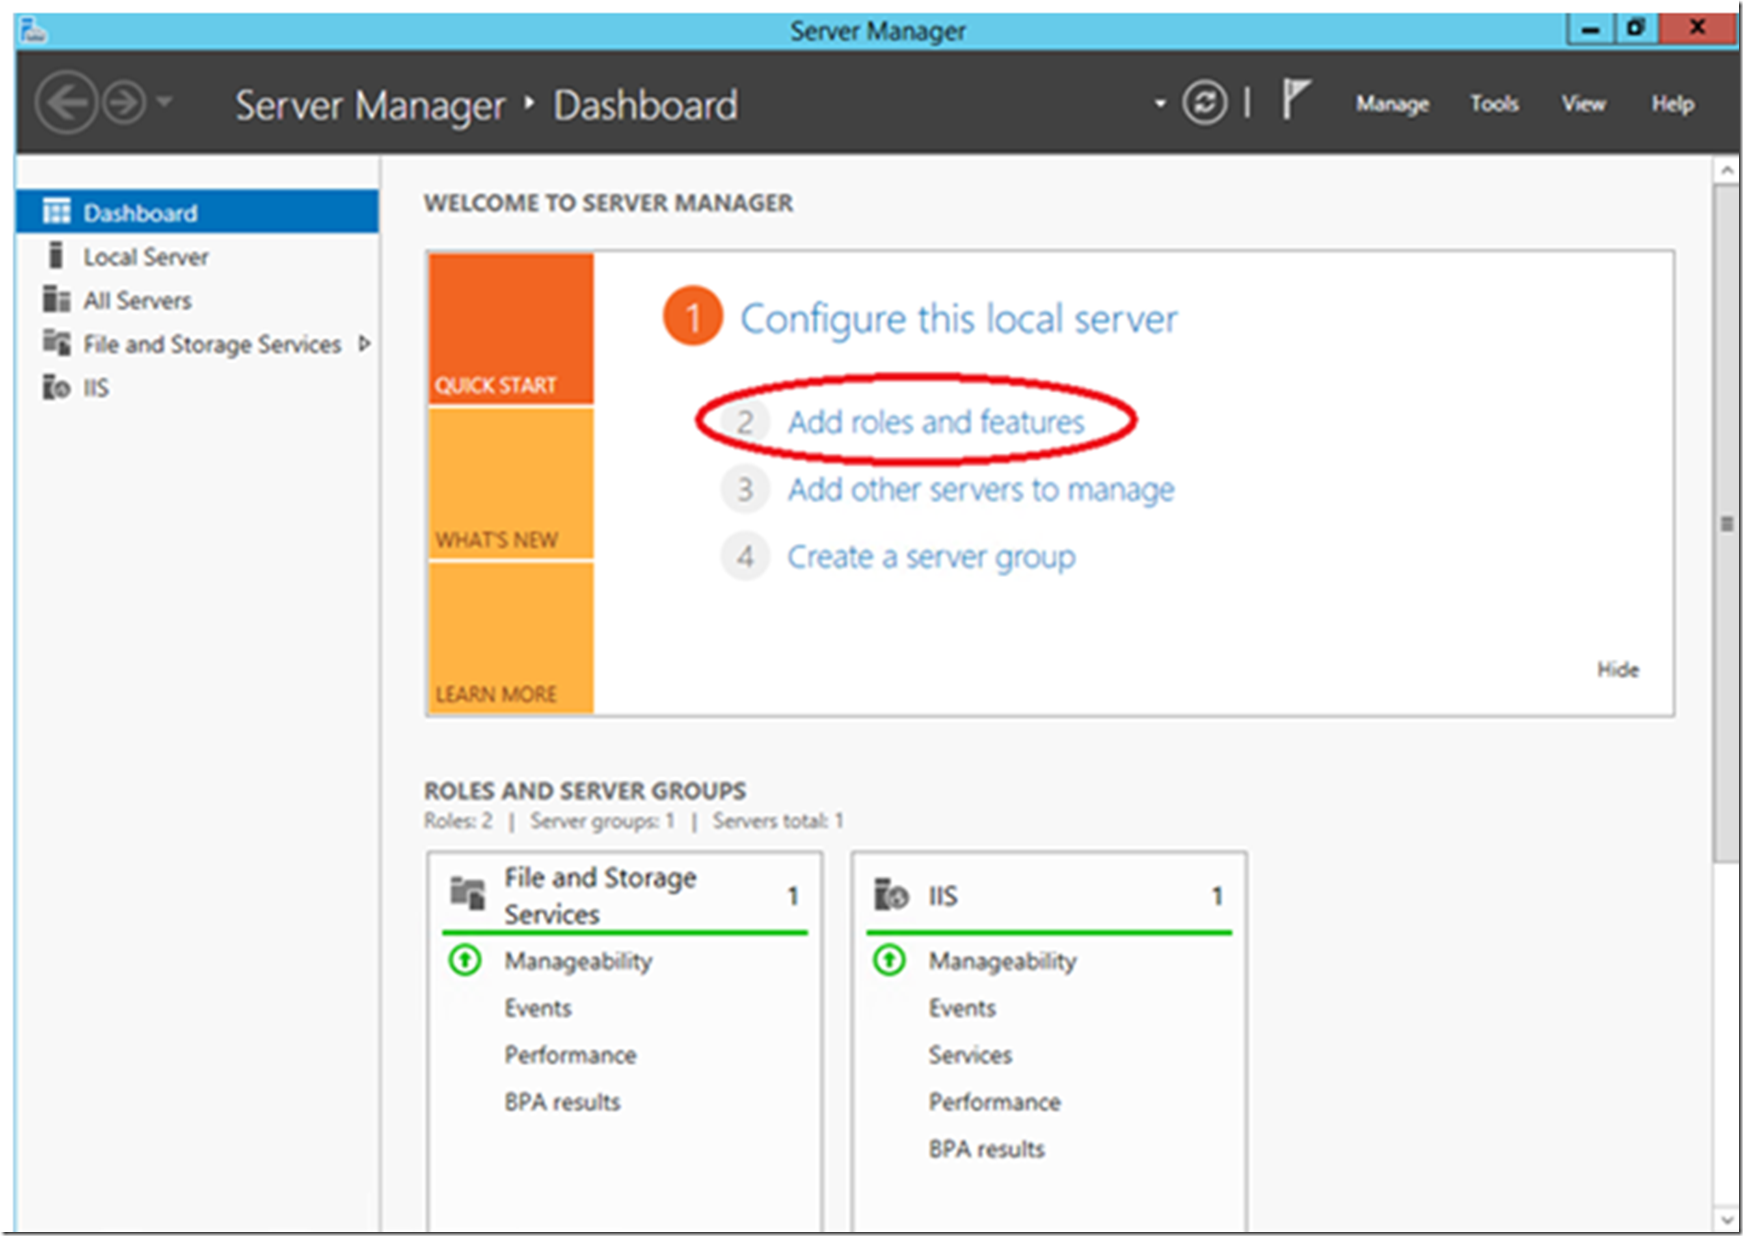
The first step is to install the role via the Server Manager. As shown in Figure 1, open Server Manager and click on Add roles and features.
Figure 1, install failed request tracing via server manager
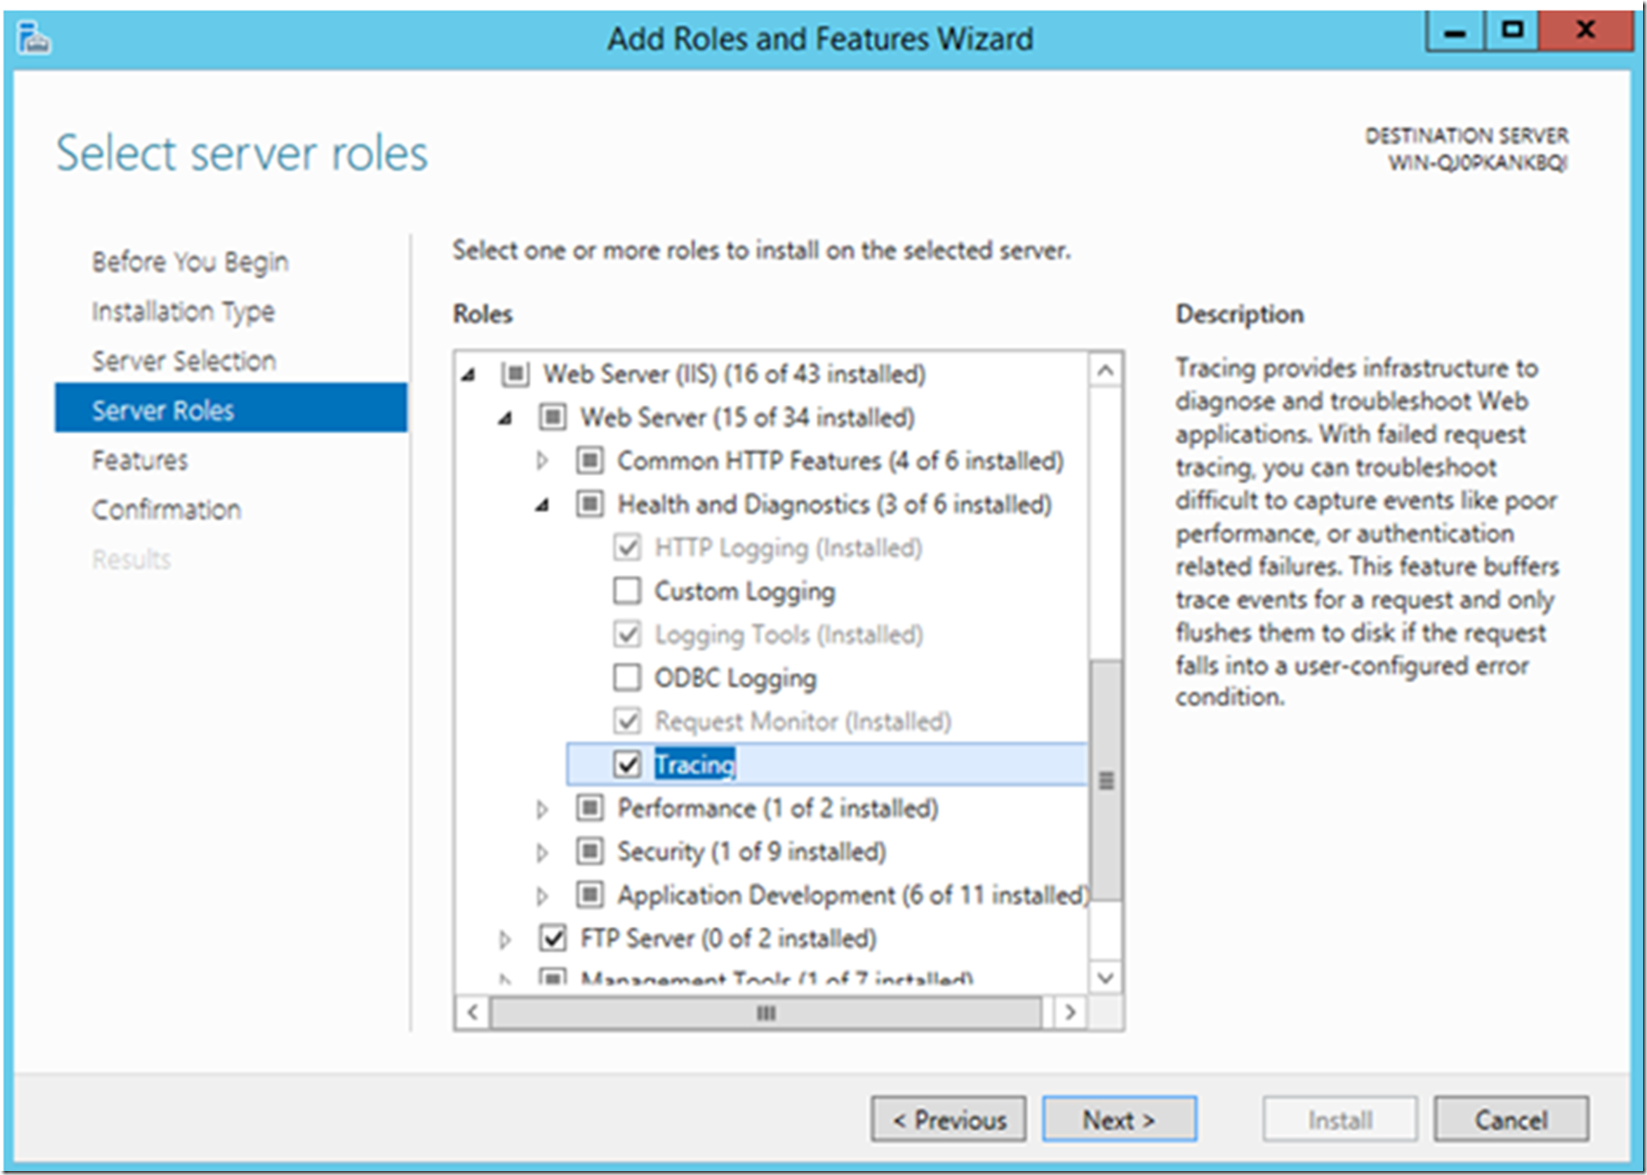
Click the Next button (~3 times), accepting the defaults, until you reach the windows illustrated via Figure 2. Scroll down and expand Web Server (IIS) -> Web Server -> Health and Diagnostics and select Tracing.
Figure 2, select Tracing from the Web Server (IIS) role
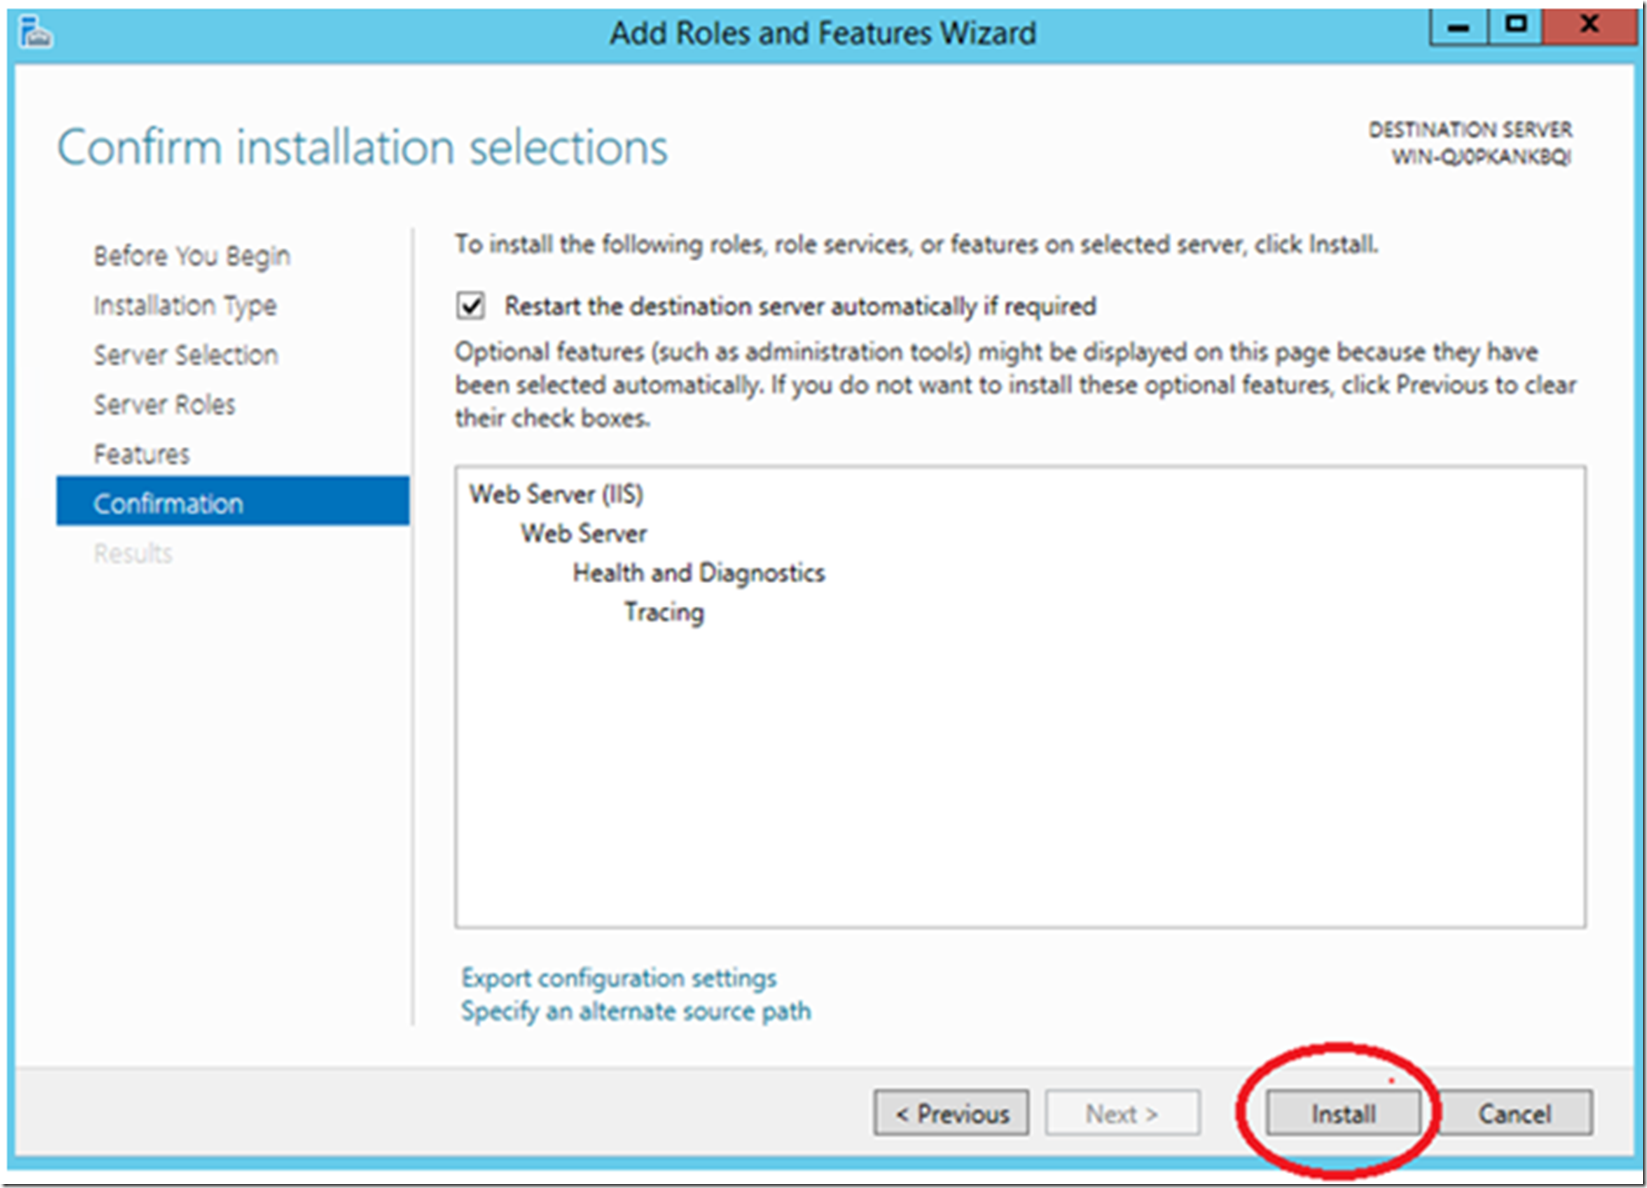
Click the Next button (~2 times) until you see the window shown in Figure 3 and click install.
Figure 3, complete the installation of Failed Request Tracing on IIS 8.5
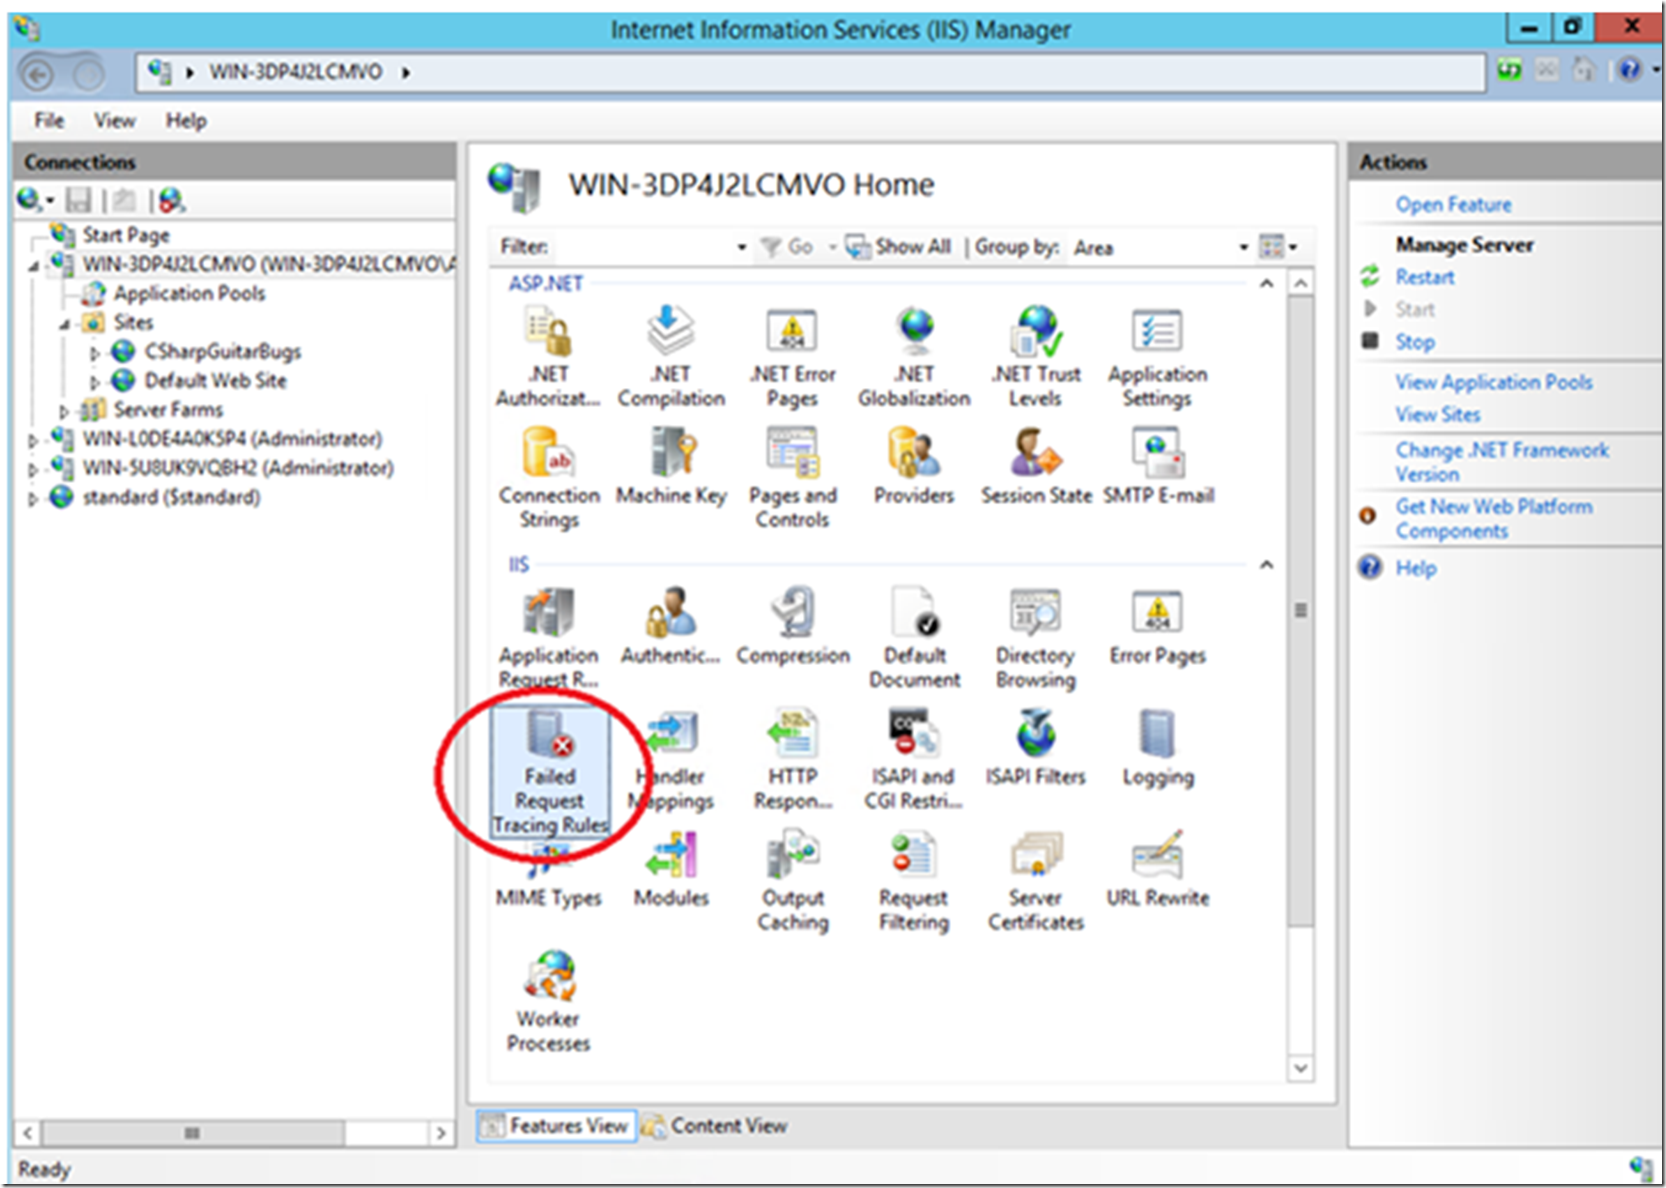
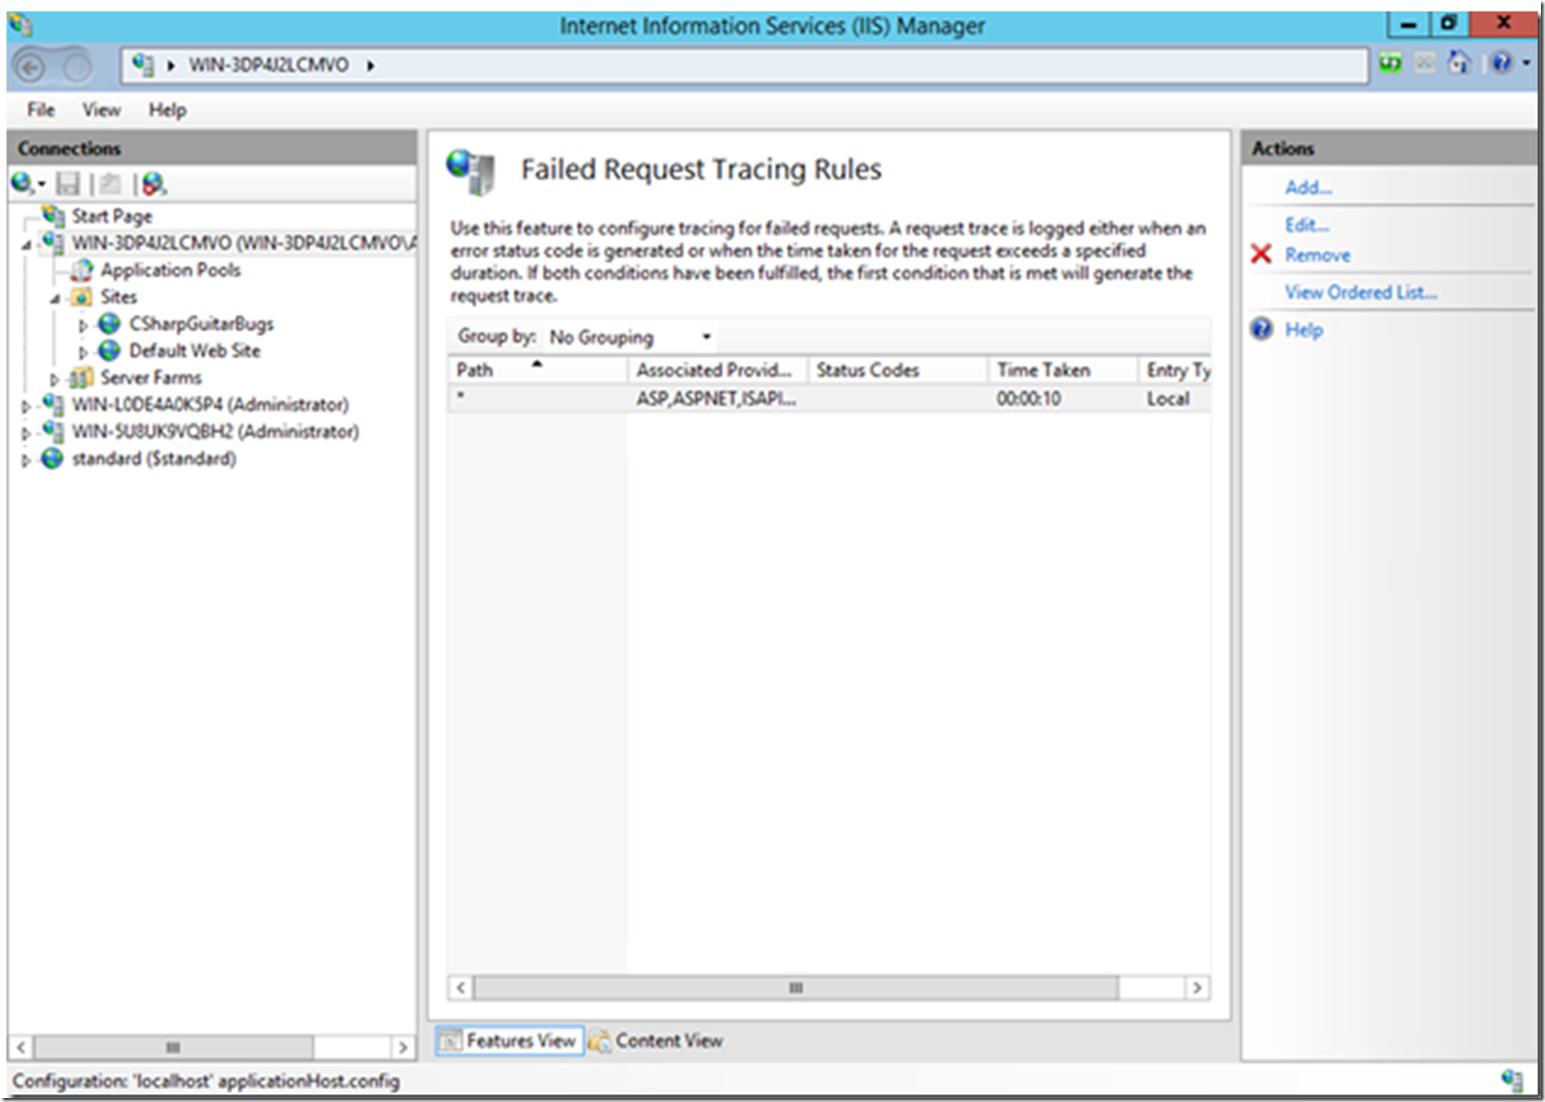
Open the IIS manager console and notice the new feature is installed, as shown in Figure 4.
Figure 4, Failed Request Tracing is successfully installed
Configure Failed Request Tracing
Now that Failed Request Tracing is installed, let’s configure it. In this scenario, there is a page that takes too long to load and you want to find out why.
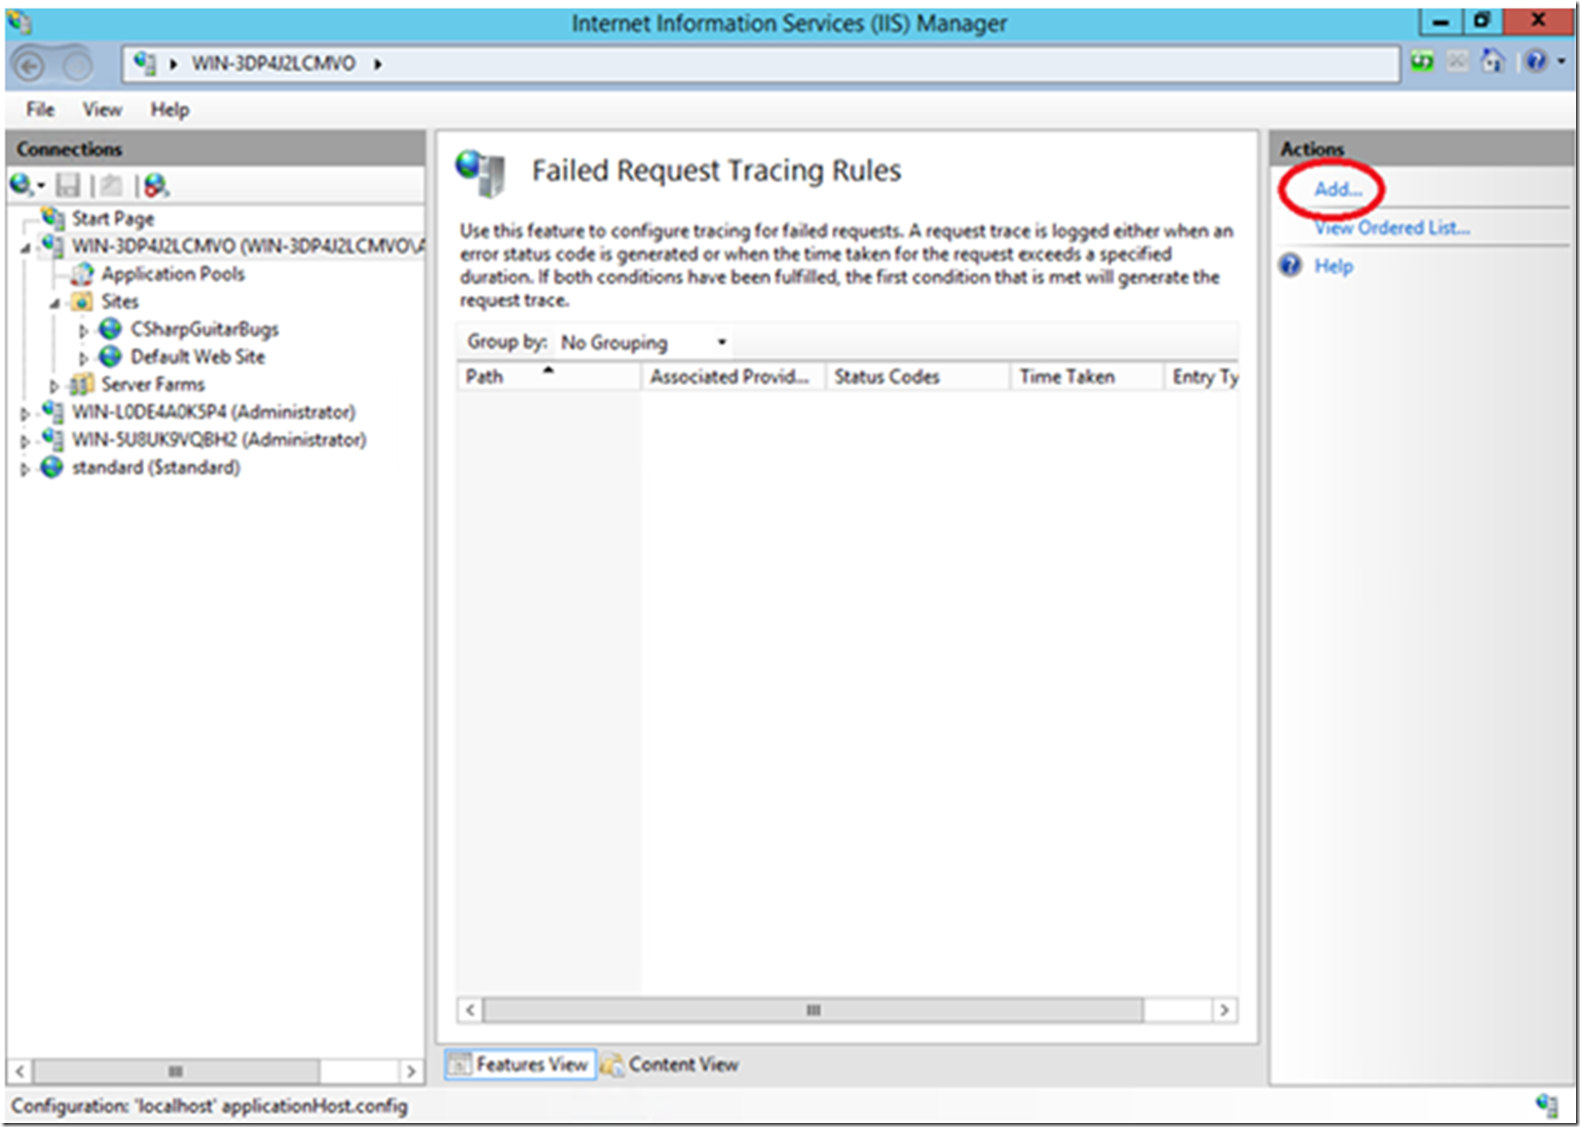
Start by double-clicking on the Failed Request Tracing Rules feature from the feature pane, as seen in Figure 4. This opens the page shown in Figure 5, click the Add link on the action pane.
Figure 5, add a rule to Failed Request Tracing
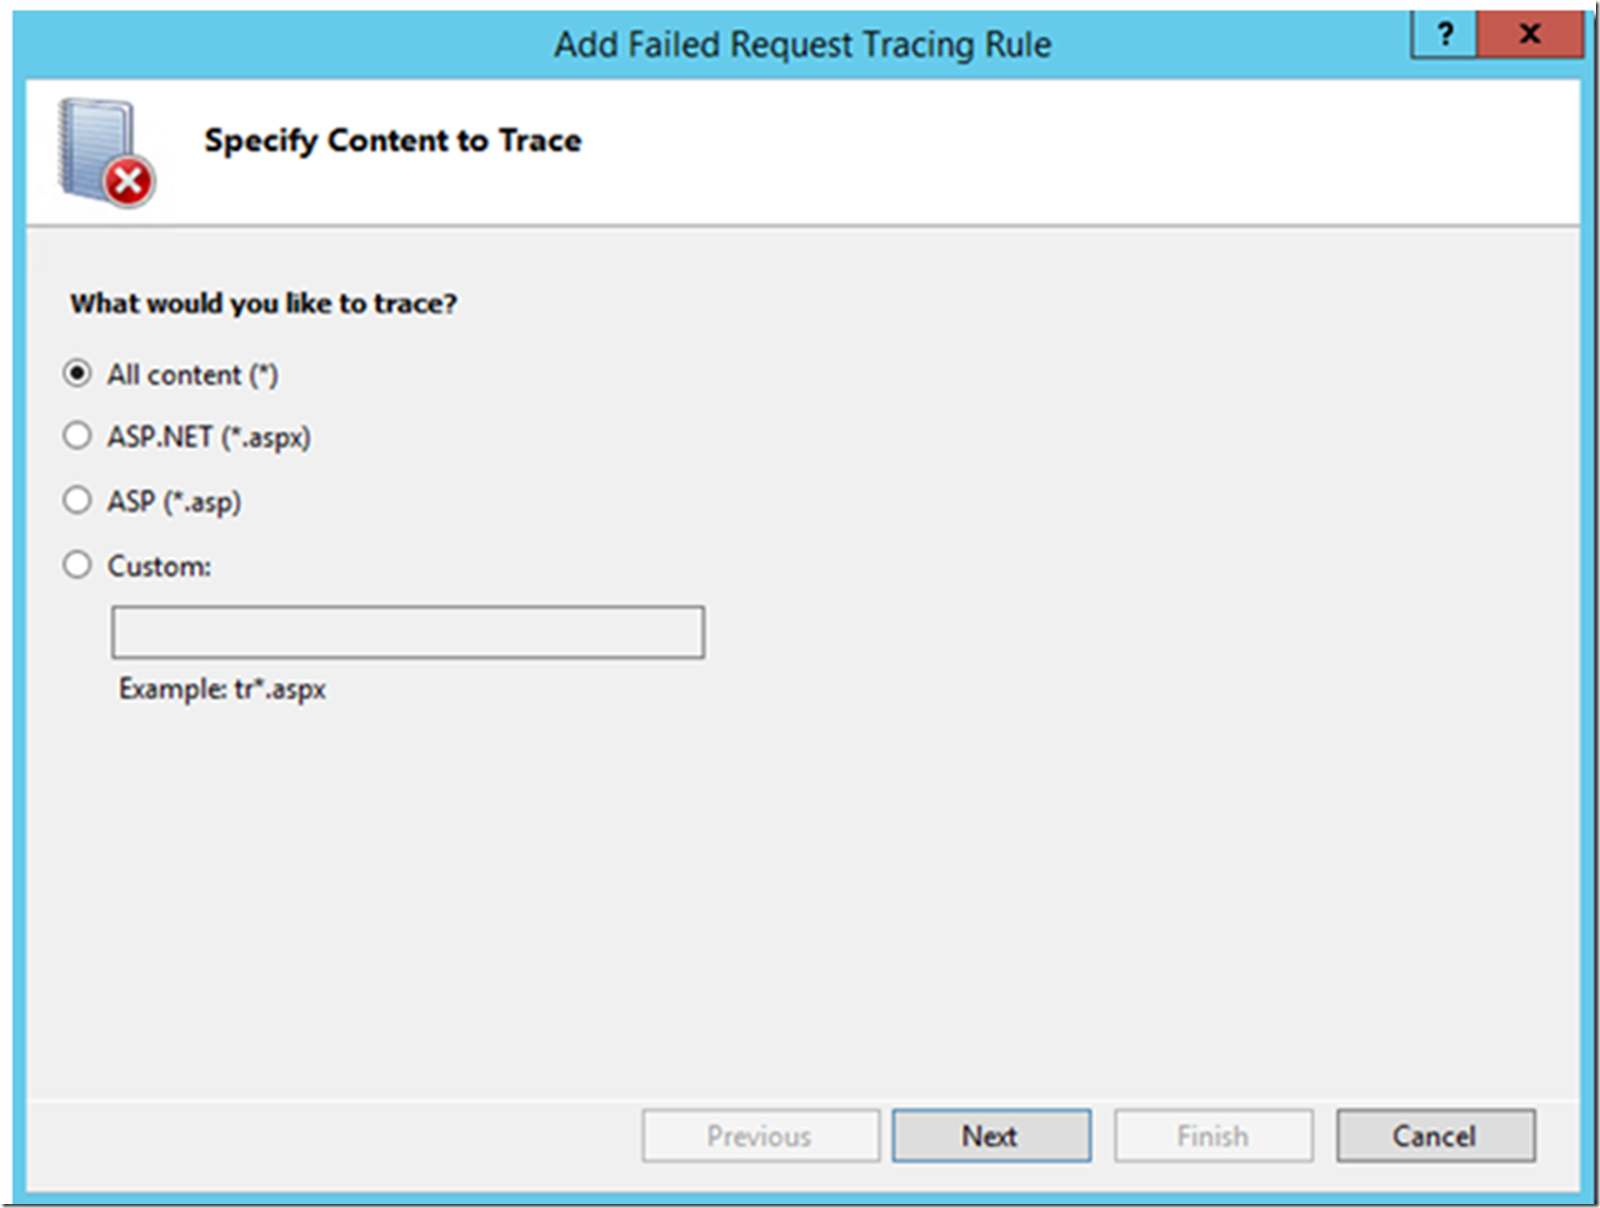
After clicking the Add link from the action pane, a configuration wizard starts that captures the required information for a rule. The first window, Figure 6, requests the type of page you want to monitor. For this example, leave the default and click the next button.
Figure 6, what kind of trace would you like?
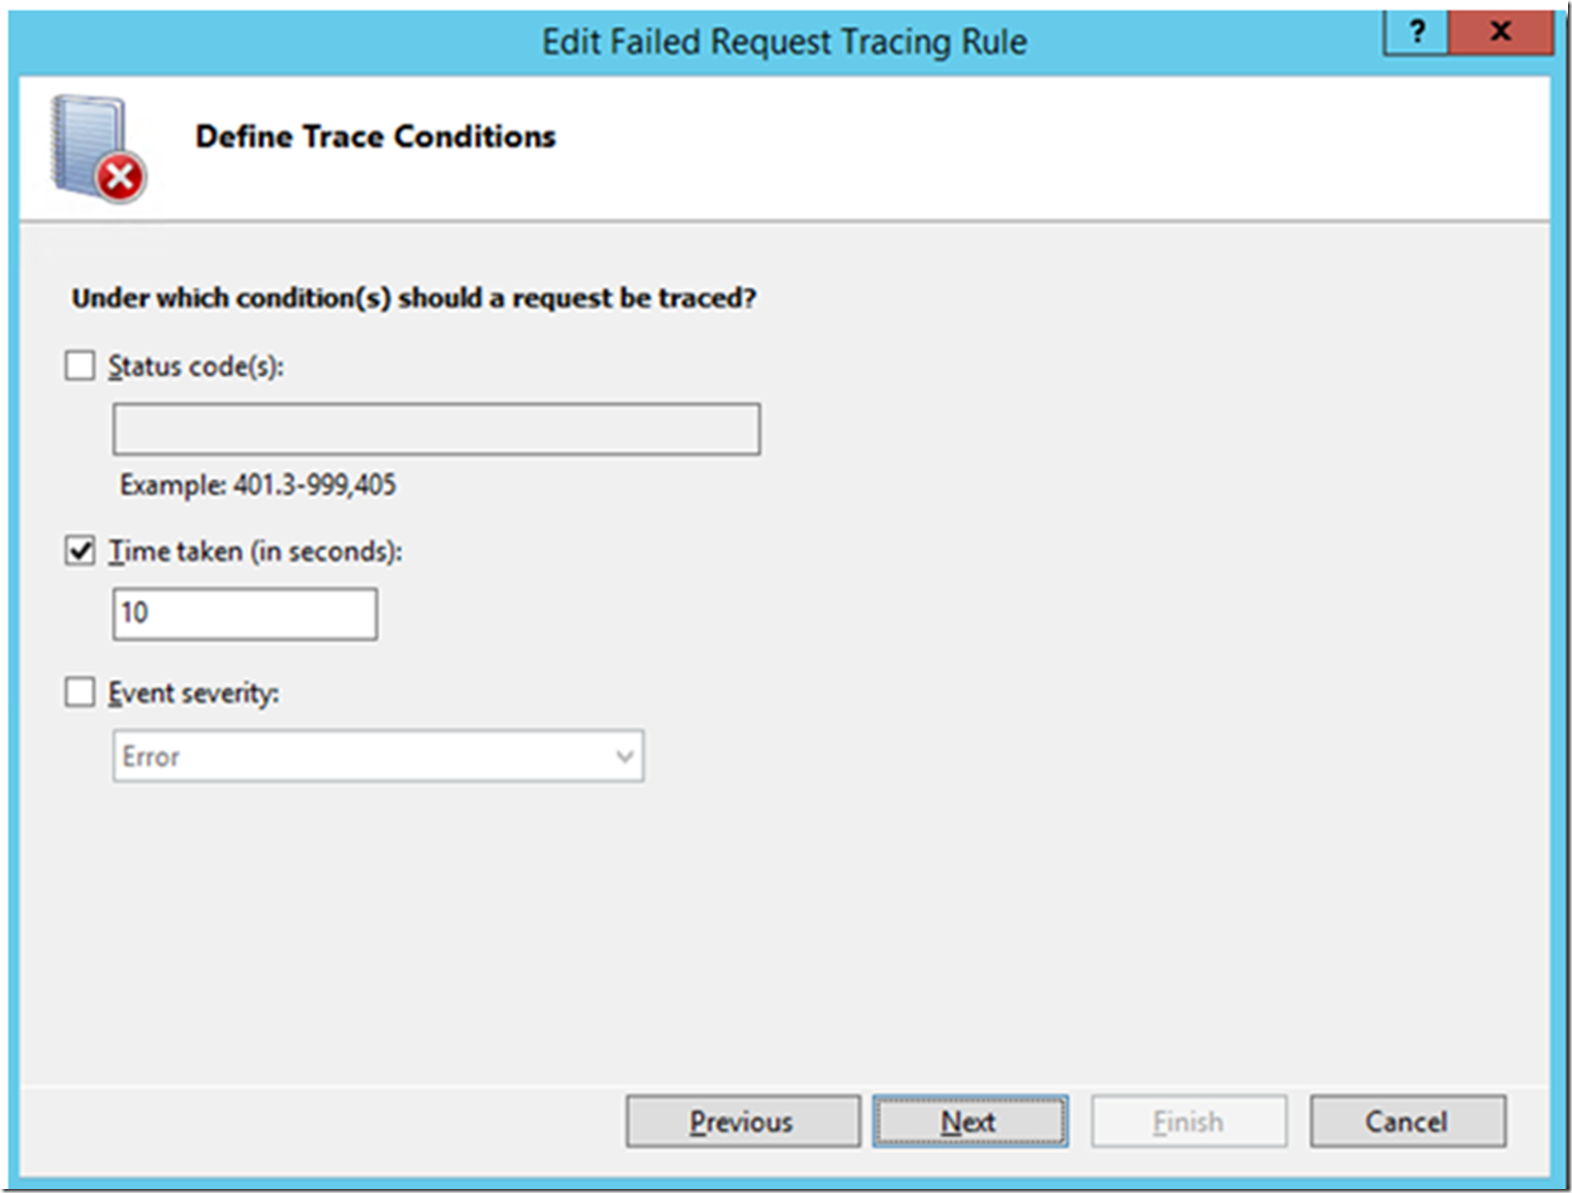
Clicking the Next button, open the window shown in Figure 7. It is possible to capture a trace based on Status code, time-taken or severity. For this lab, capture a trace when the request takes 6 or more seconds to complete.
Figure 7, capture a trace when the time taken is longer than expected
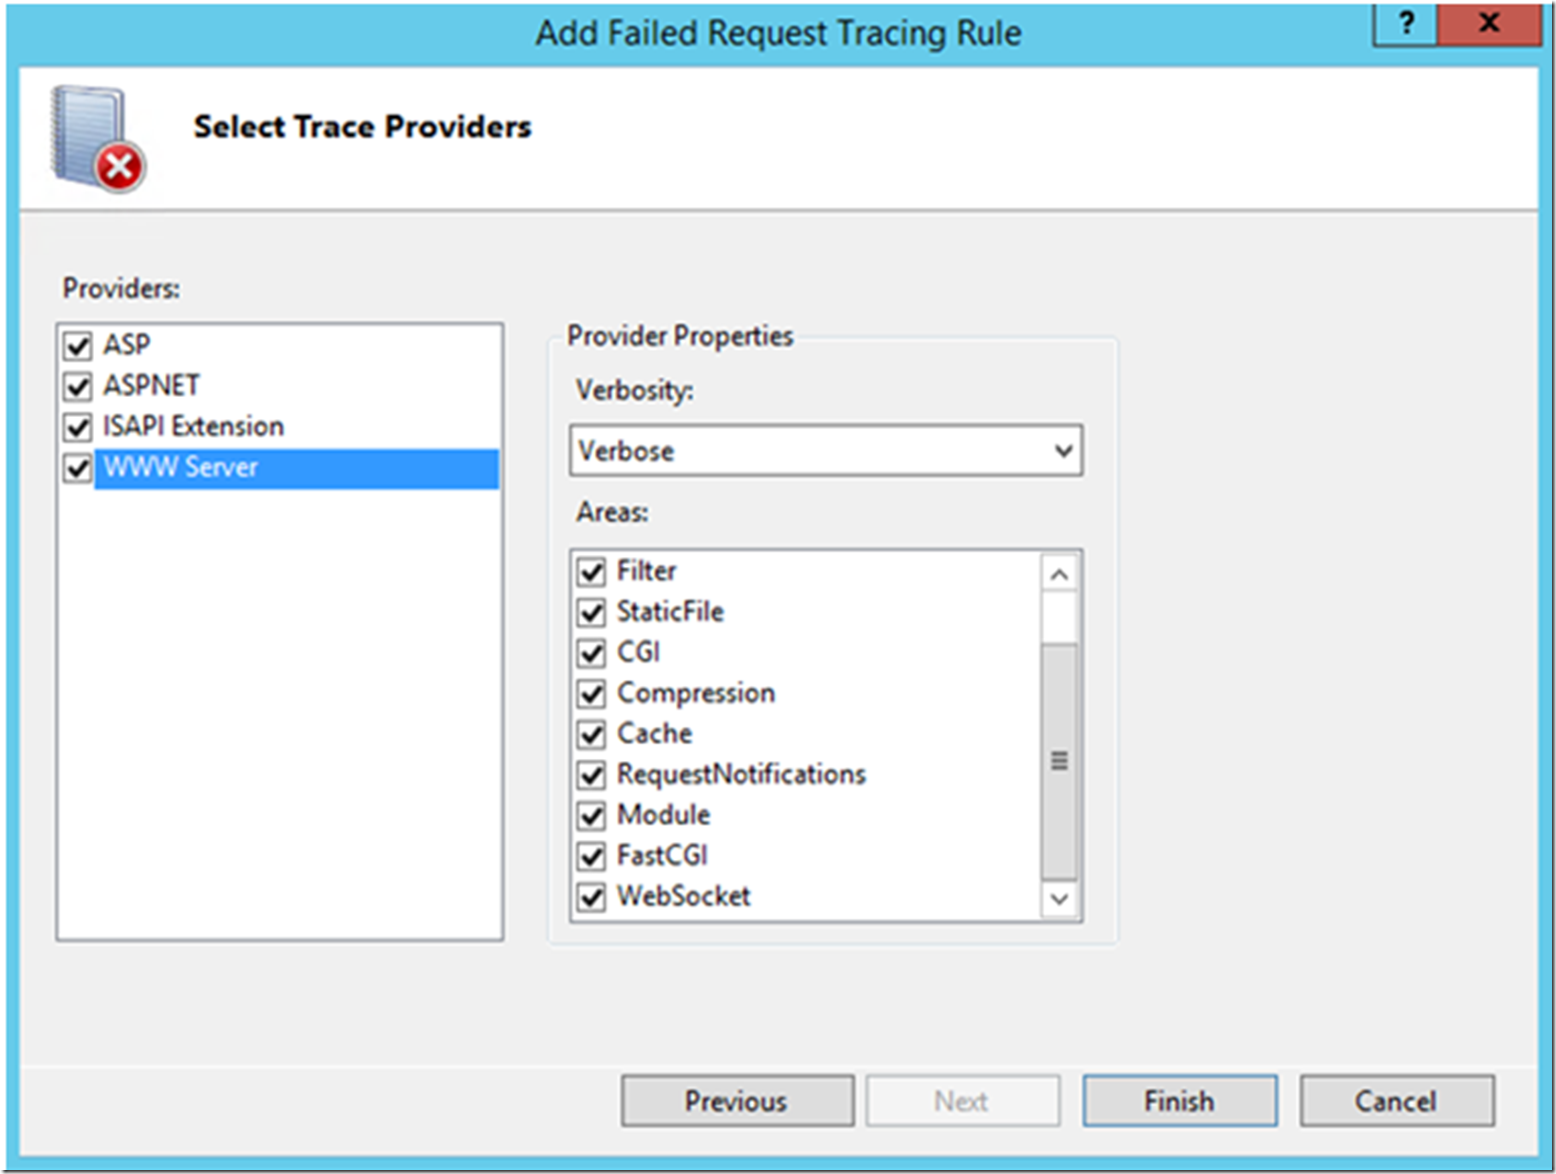
Click the next button, which displays that shown in Figure 8. This window lets you select the:
- Providers – Limit the trace to a specific event pipeline
- Provider Properties
- Verbosity – General, Critical Errors, Errors, Warnings, Information and Verbose. The more verbose it is, the more information you get. I recommend the most, unless you know specifically what you are after.
- Area – Limit the log to a specific module handling the request
Have a read of this article here that explains how to troubleshoot a request that uses Url Rewrite. It illustrates selecting only a specific Provider and Area so that you get only the information you are after.
Figure 8, Failed request tracing providers, verbosity and areas
Complete the configuration of the rule by pressing the Finish button. Figure 9 shows that the rule is now configured, but note, that although the rule is configured, it is no enabled.
Figure 9, failed request tracing rule configured but not enabled
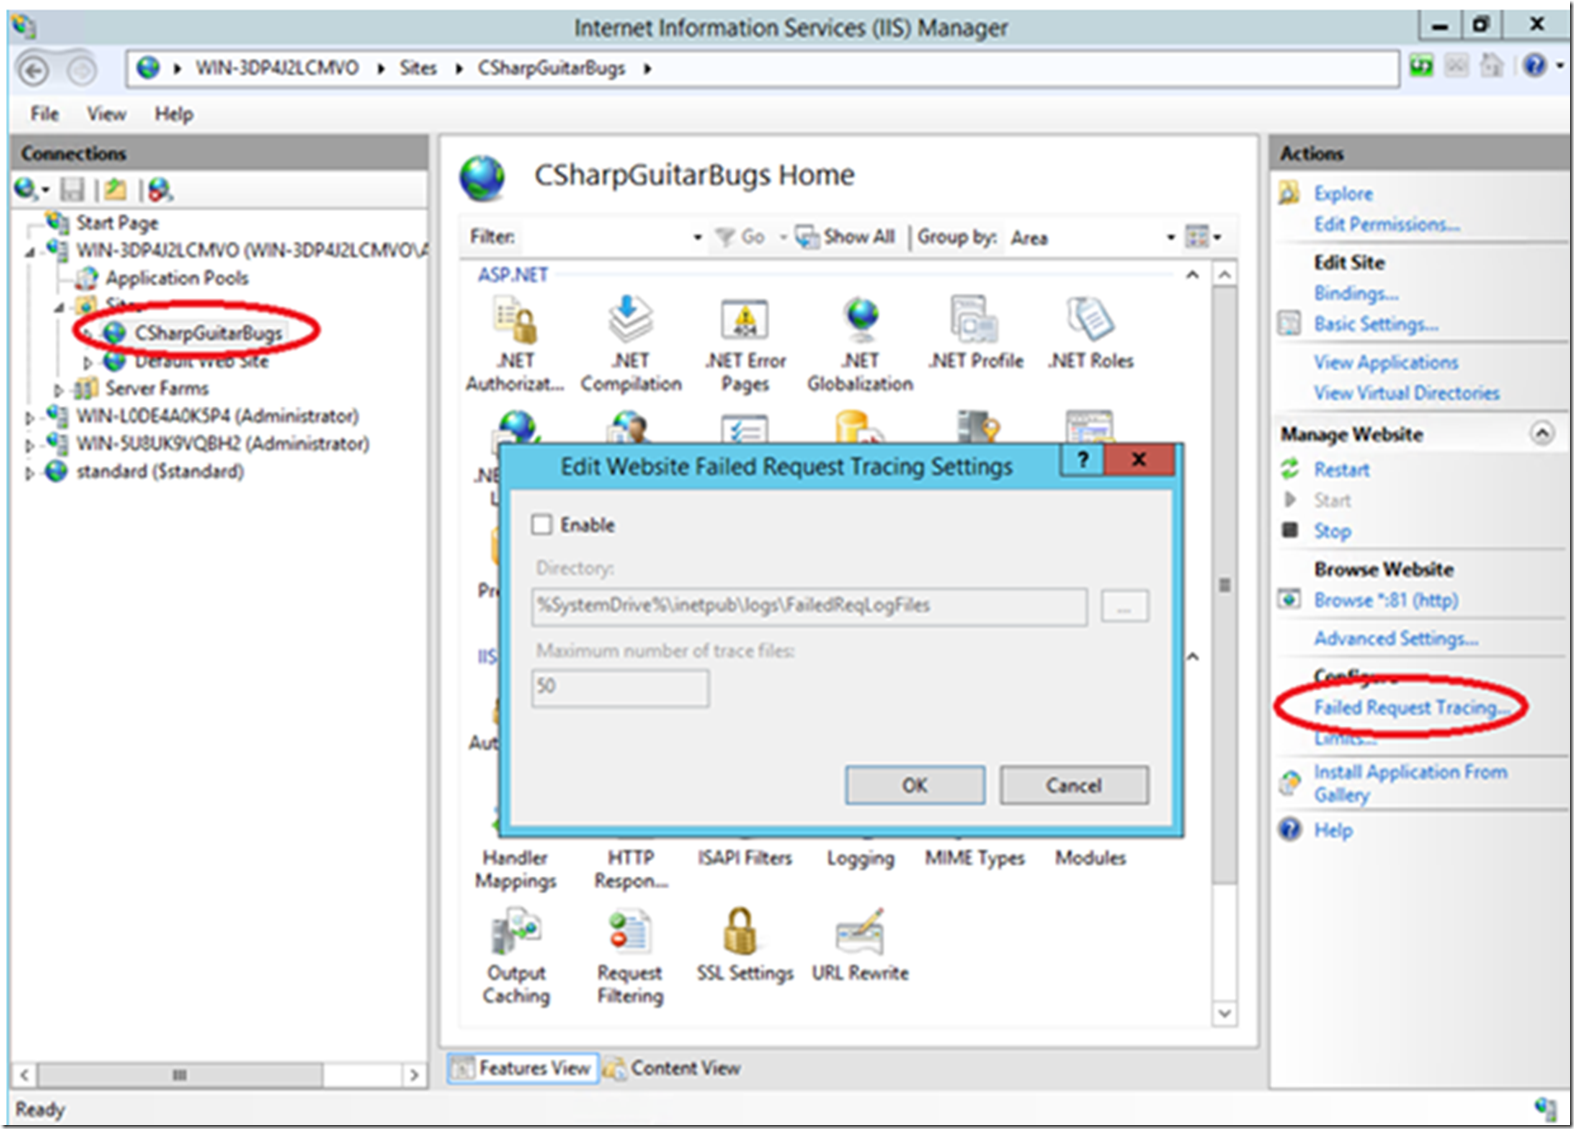
To enable the Failed Request Tracing rule, click on the web site where you want to capture the trace and click on the Failed Request Tracing… link in the action pane, as shown in Figure 10.
Figure 10, enable the Failed Request Tracing for the web site
Notice that the tracing is not enabled. Click on the Enable checkbox and then OK, to enable the tracing. Notice that the location in which the logs are written and the maximum number files are configurable. By default the maximum number of files is set to 50. This means that the 51st trace will overwrite the 1st so make sure to set that value appropriately.
Capture and review the Failed Request Trace
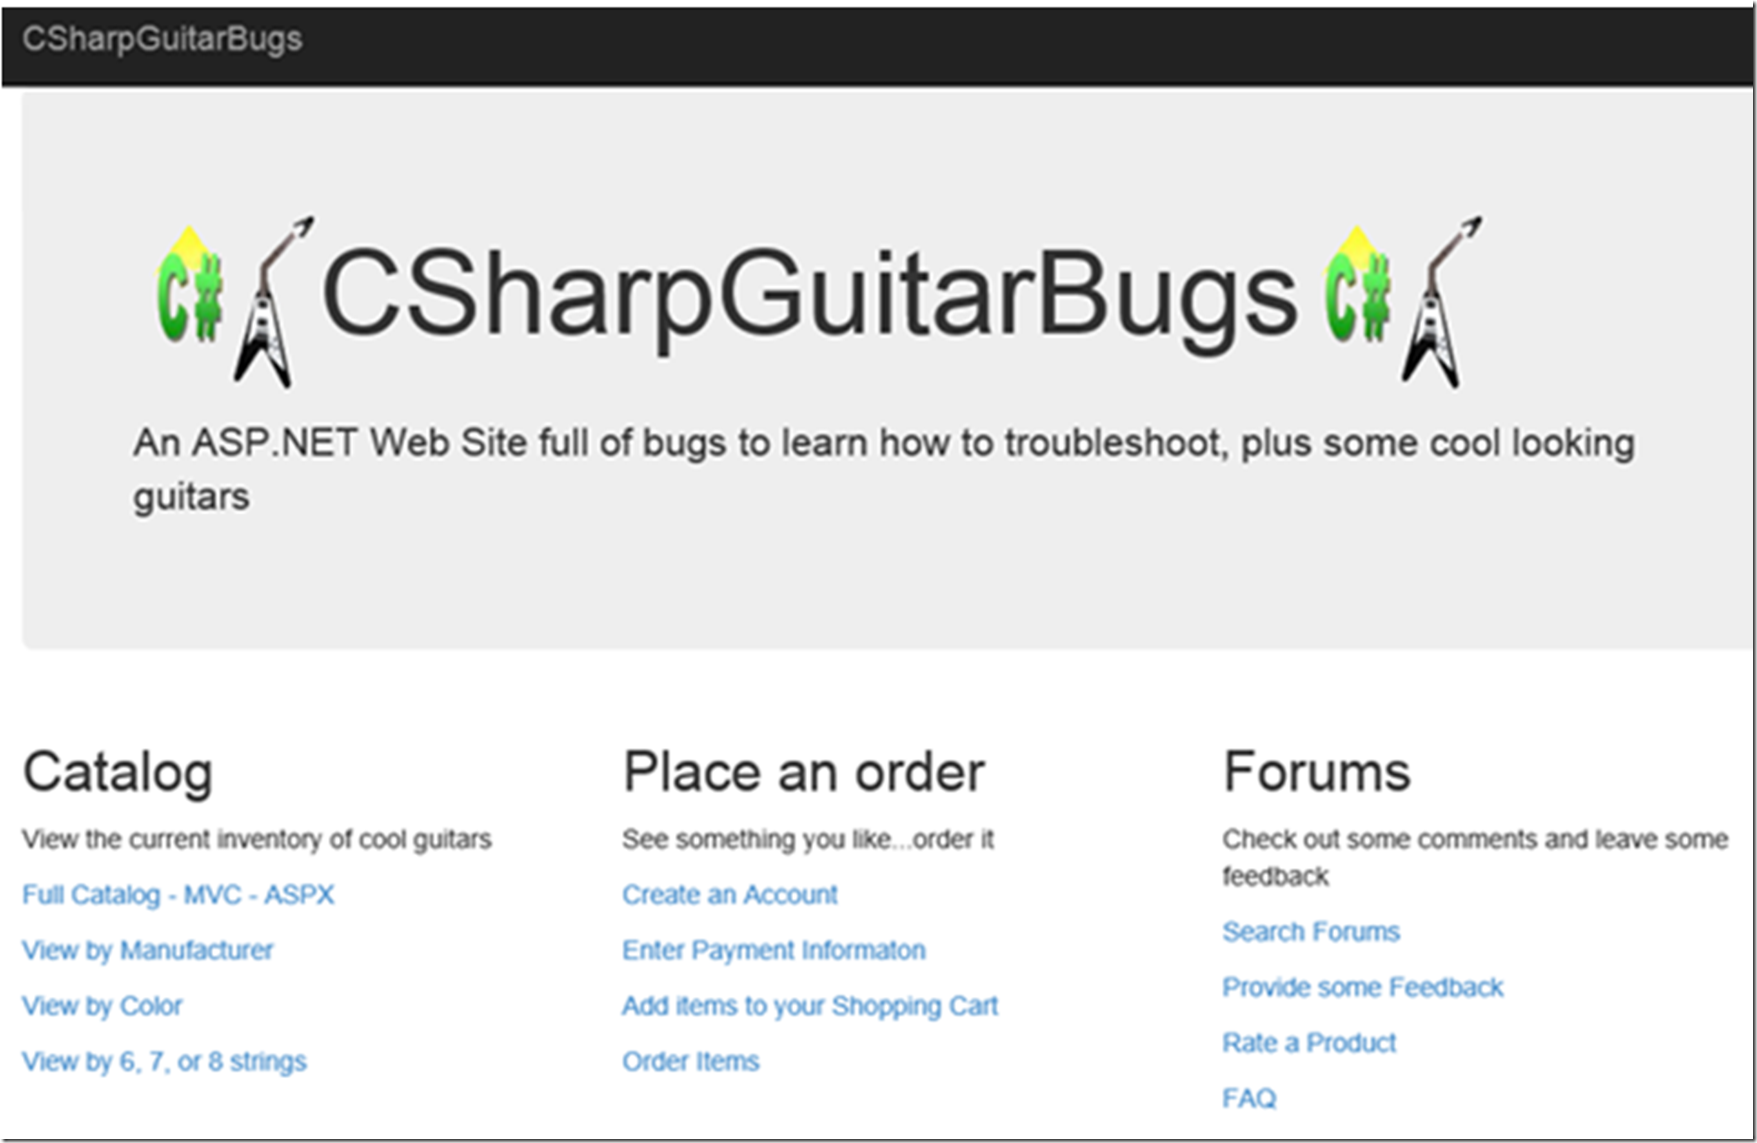
Browse to the CSharpGuitarBugs website you created in Lab 1 here, as shown in Figure 11 and click on the Full Catalog – ASPX link.
Figure 11, the CSharpGuitarBuggs buggy website, slow running request, all products
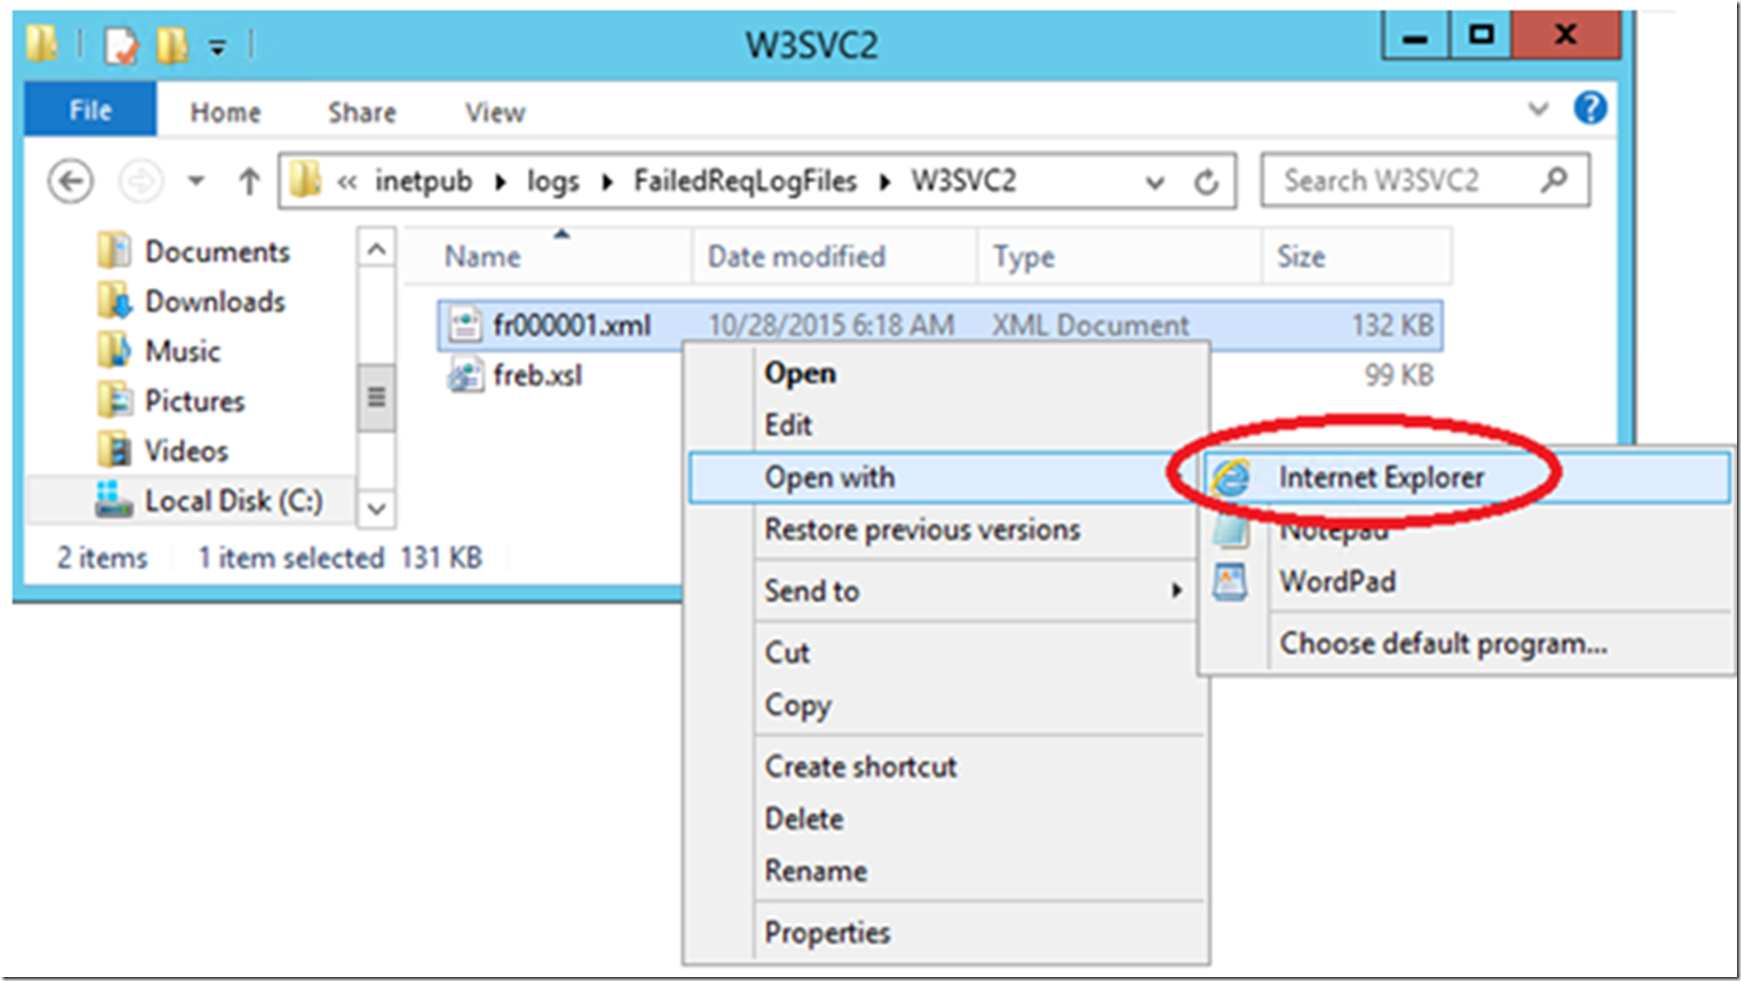
This requests takes some time, over 10 seconds in this case and a Failed Request Trace log is created, as shown in Figure 12.
Figure 12, a failed request trace
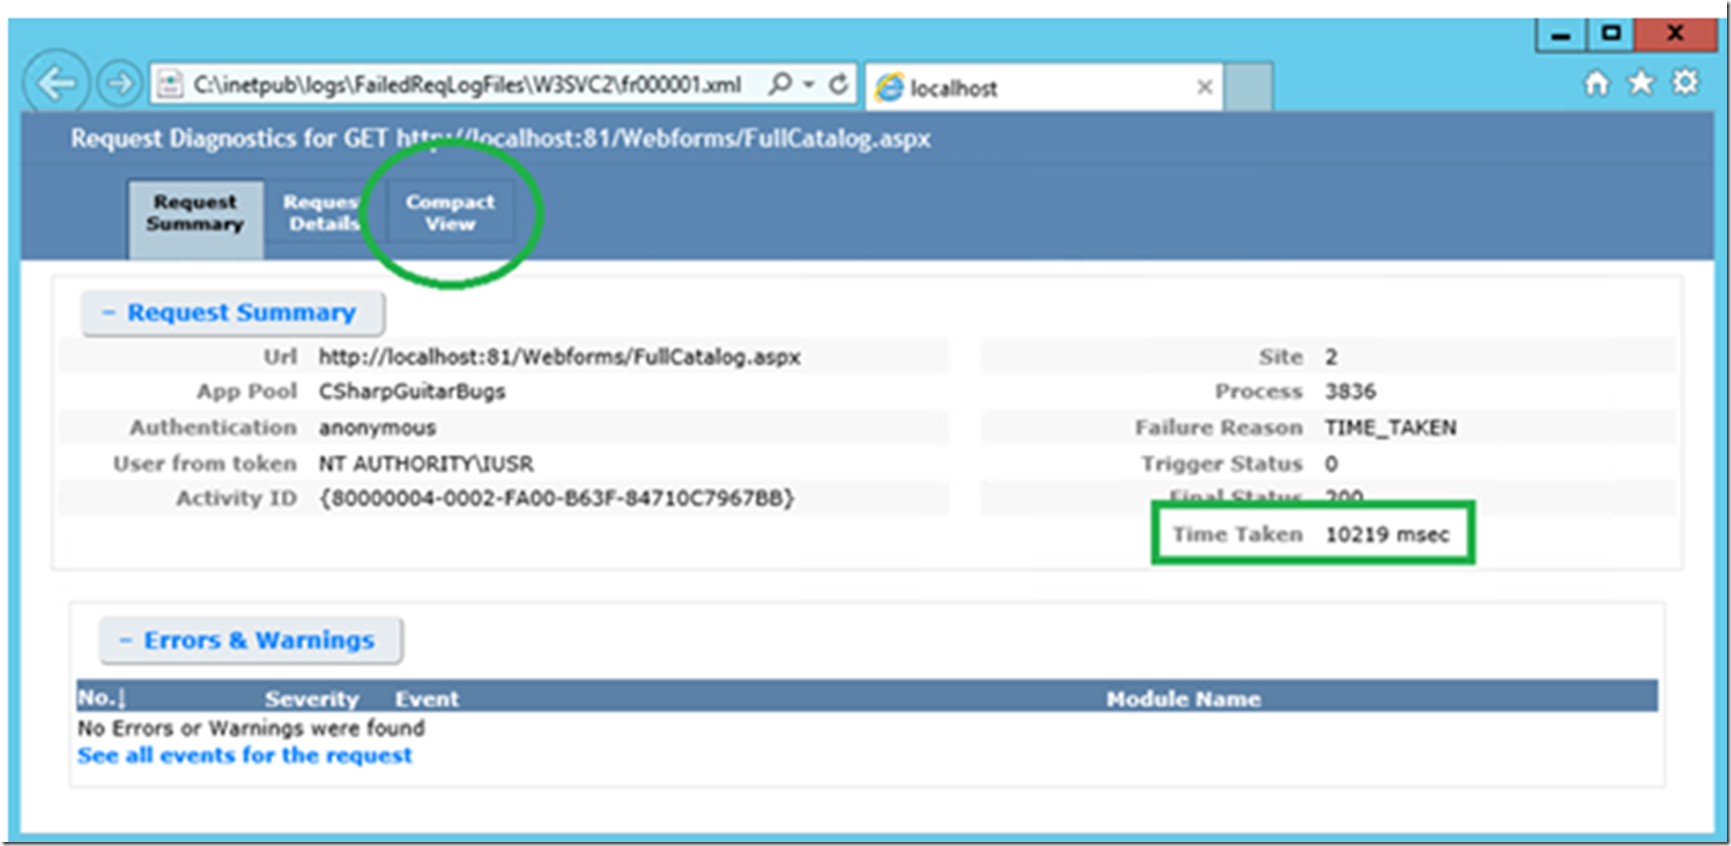
Right-click on the fr000*.xml file -> Open with -> Internet Explorer to view the trace, as shown in Figure 13.
Figure 13, Failed Request Tracing output
Notice that the Time Taken is greater that 10 seconds as per the rule and that the request was made to an ASPX file, which is an ASP.NET Webform page. Failed Request Tracing is best for troubleshooting ASP.NET Webforms performance issues. Click on Compact View and scroll down, keeping an eye on the Time column. Points to look for:
- Look for differences in the Time column, this is where you can pinpoint where in the request pipeline the time has been spent,for example, if in row 10 the time was 10:54:15 and in row 11 the time was 10:54:22, then you would look at what was happening in row 10 to see why it took so long
- Look at the end of the log, as shown in Figure 14. Once the time taken threshold has been breached, the Failed Request Tracing log is written. Therefore, if what took place in row 136, up to this point, has taken longer than the threshold then, or took longer itself, then the log is written before the request is completed.
Figure 14, failed request trace log example
Also note as shown in Figure 14 that some of the ASP.NET Webform events are shown in brackets. For example, the AspNetPagePreInitEnter/Leave in row 132-133 correspond with the Page_PreInit() method, the AspNetPageInitEnter/Leave on row 134/135 which corresponds to the Page_Init() and where the log stops being written on line 136 is the AspNetPageLoadEnter (notice there is no Leave) which corresponds to the Page_Load() method. Therefore, this is the method you would look at to determine why the request is taking more time than expected. Perhaps it contains some nested loops, poorly written SQL queries or a call to an external service which is responding slow. Check the code in that method.
NOTE: Another great use of this tracing is if a user mentions the site was slow sometime last week, or can only mention that the site is slow during given time periods with no specific request identified. You can enable this and let it run in the back ground and then review the logs at the end of each day searching for slow requests logs.
Using PerfVeiw to trace a slow performing ASP.NET MVC request
Mentioned at the beginning of this lab, Failed request tracing is a very useful tool for finding performance issues for specific ASP.NET Webform (ASPX) requests. However, due to the differences between the pipeline flow of the ASP.NET MVC application there is a better tool for finding specifically where within the request the slowness is happening. Follow these instructions to capture a trace of a slow performing ASP.NET MVC request using PerfView.
- Download Perfview from here and copy onto the machine where slow request can be reproduced. For example into the C:\temp drive.
- Launch Perfview.exe, and click Collect Menu item and choose Collect or press (Alt + C)
- Choose the path where trace log will be created under Data File field, by default it’s stored in the location where the EXE is located
- Check the checkbox options Zip, Merge, and Thread Time
- Set Circular MB to 800 MB
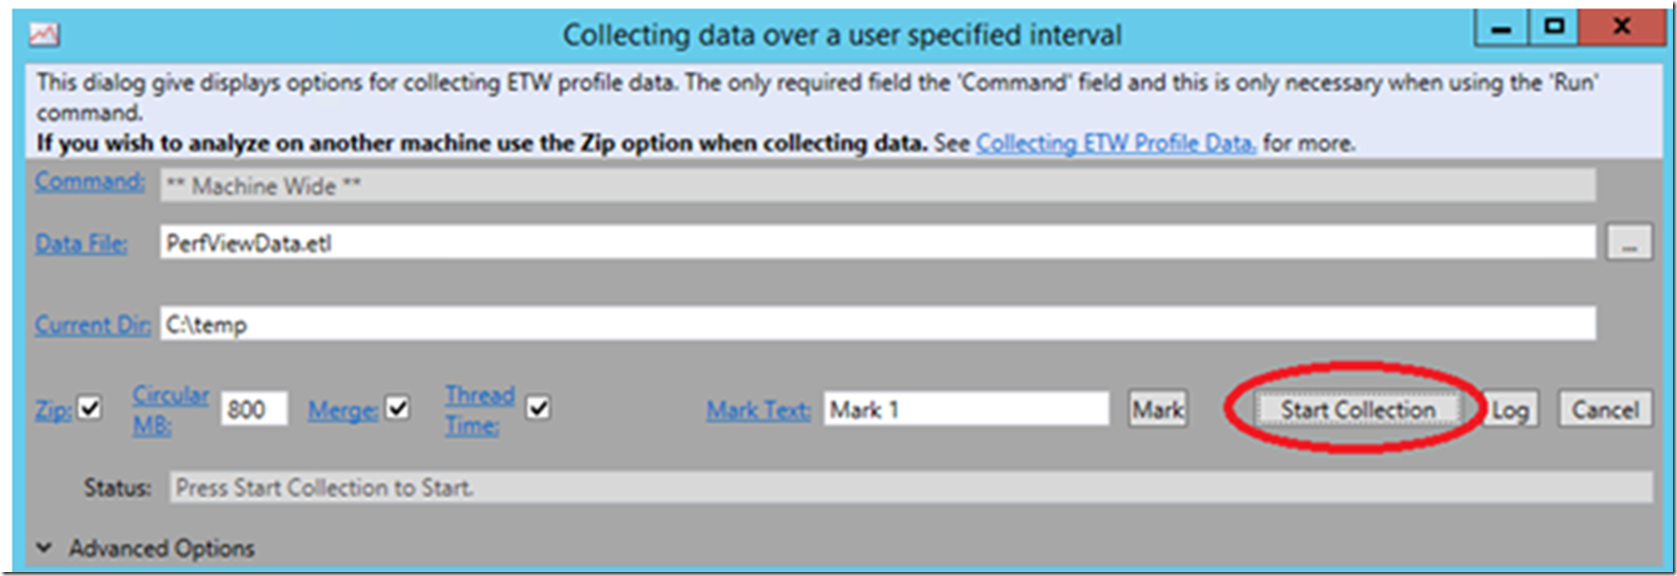
- Now, click on the Start Collection button as shown in Figure 15.
- While Prefview is collecting, select the Full Catalog – MVC link on the main page of the example web site and wait until the request completes
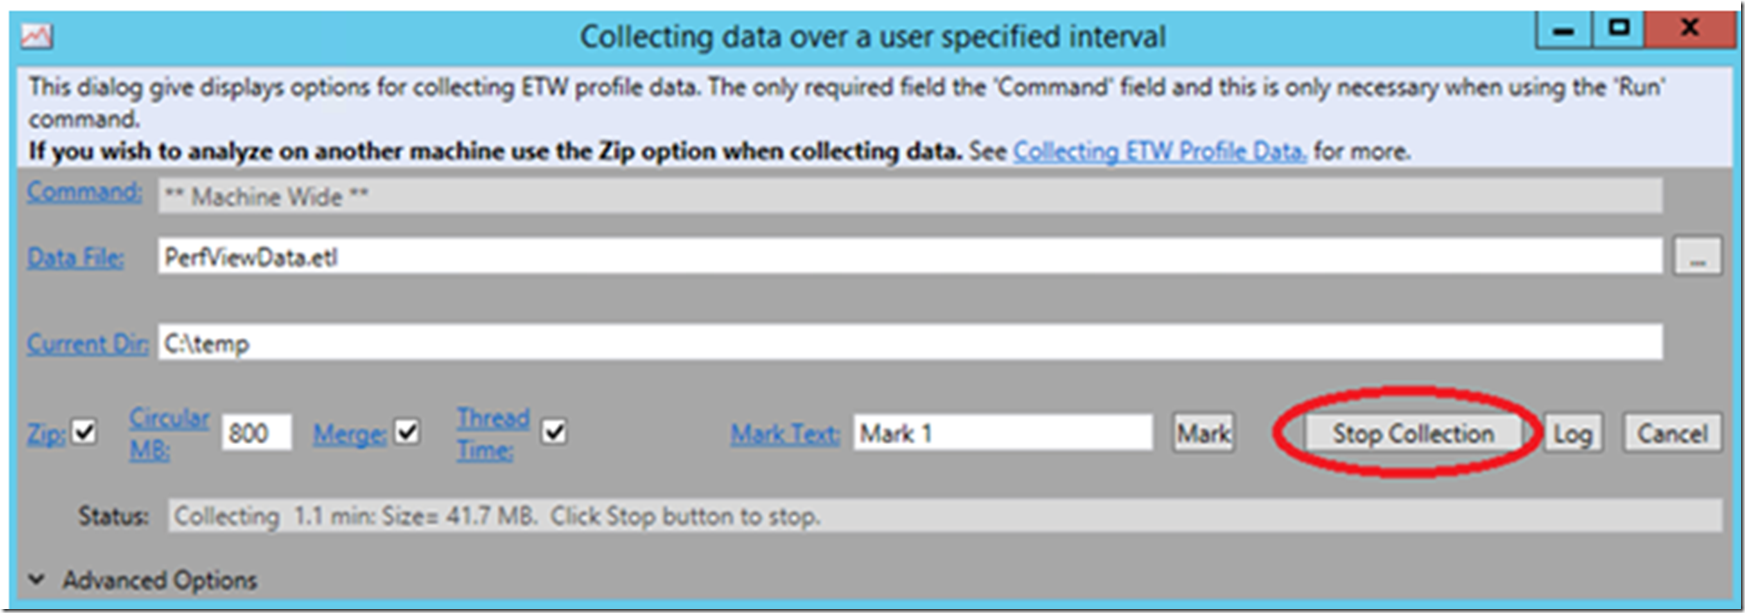
- Once the request is complete, Go to Perfview and click Stop Collection as illustrated in Figure 16.
- Perfview will start working on logs. Once it’s finished working, it’ll create a zip file containing ETL logs on the same location configured to create logs.
- Open the ETL in the PerfView tool and view this Channel 9 Video here.
Figure 15, starting trace a slow performing ASP.NET MVC request using PerfView
Figure 16, stopping trace a slow performing ASP.NET MVC request using PerfView
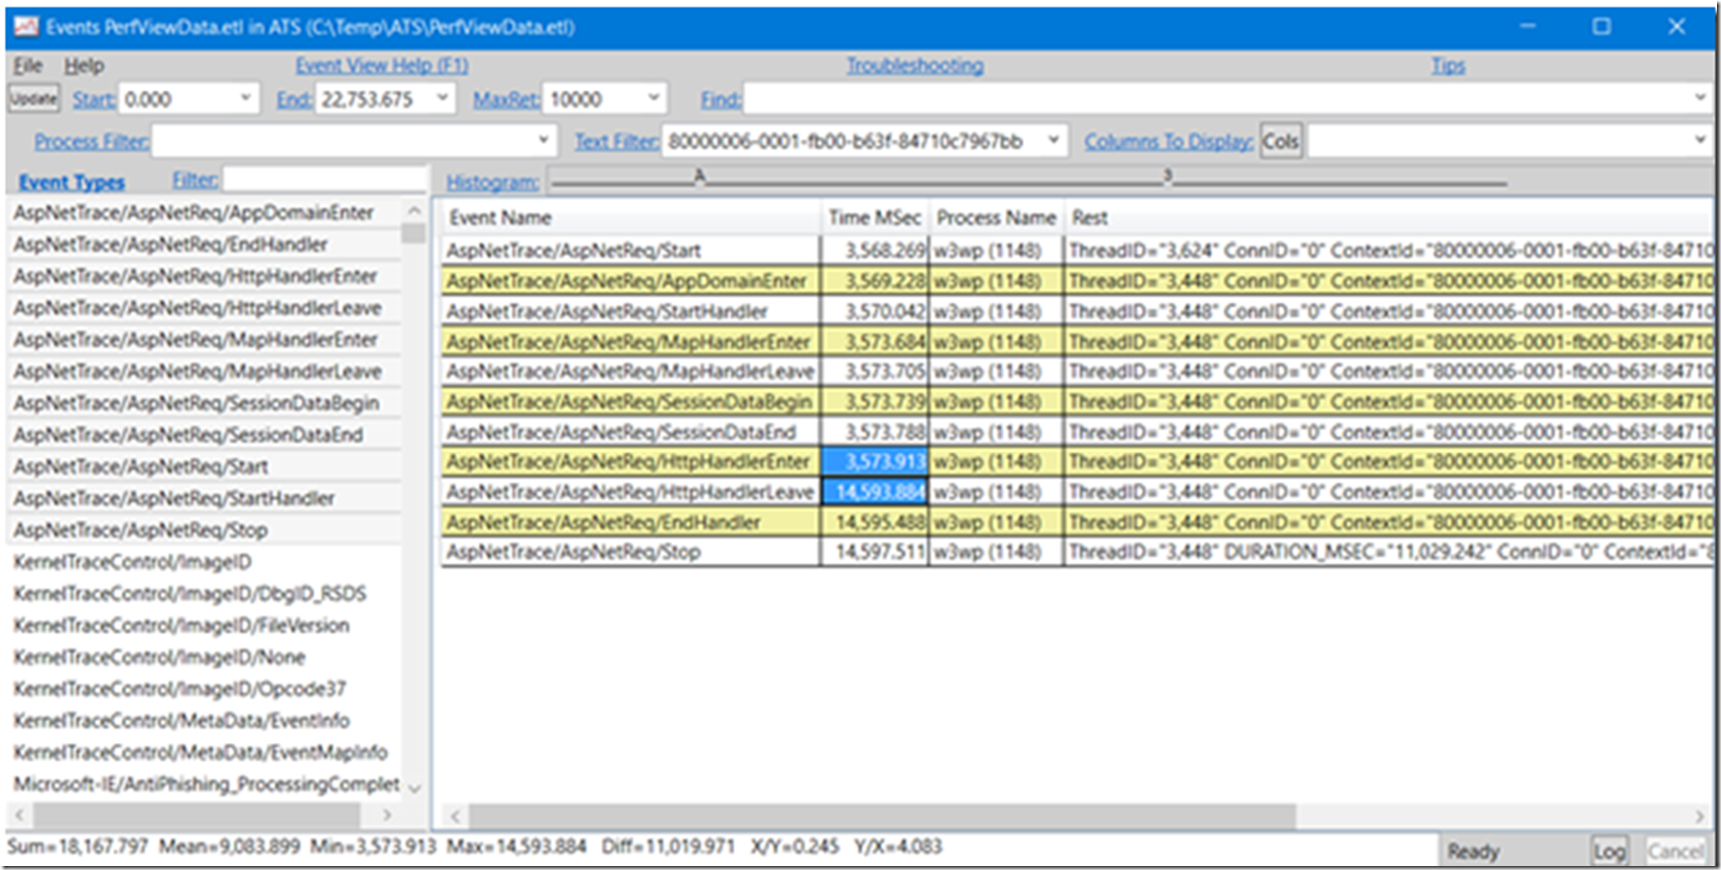
After reviewing the video, I opened the trace in PerfView and see that there are about 11 seconds between the start and the end of the request, as shown in Figure 17.
Figure 17, PerfView showing a slow ASP.NET MVC request
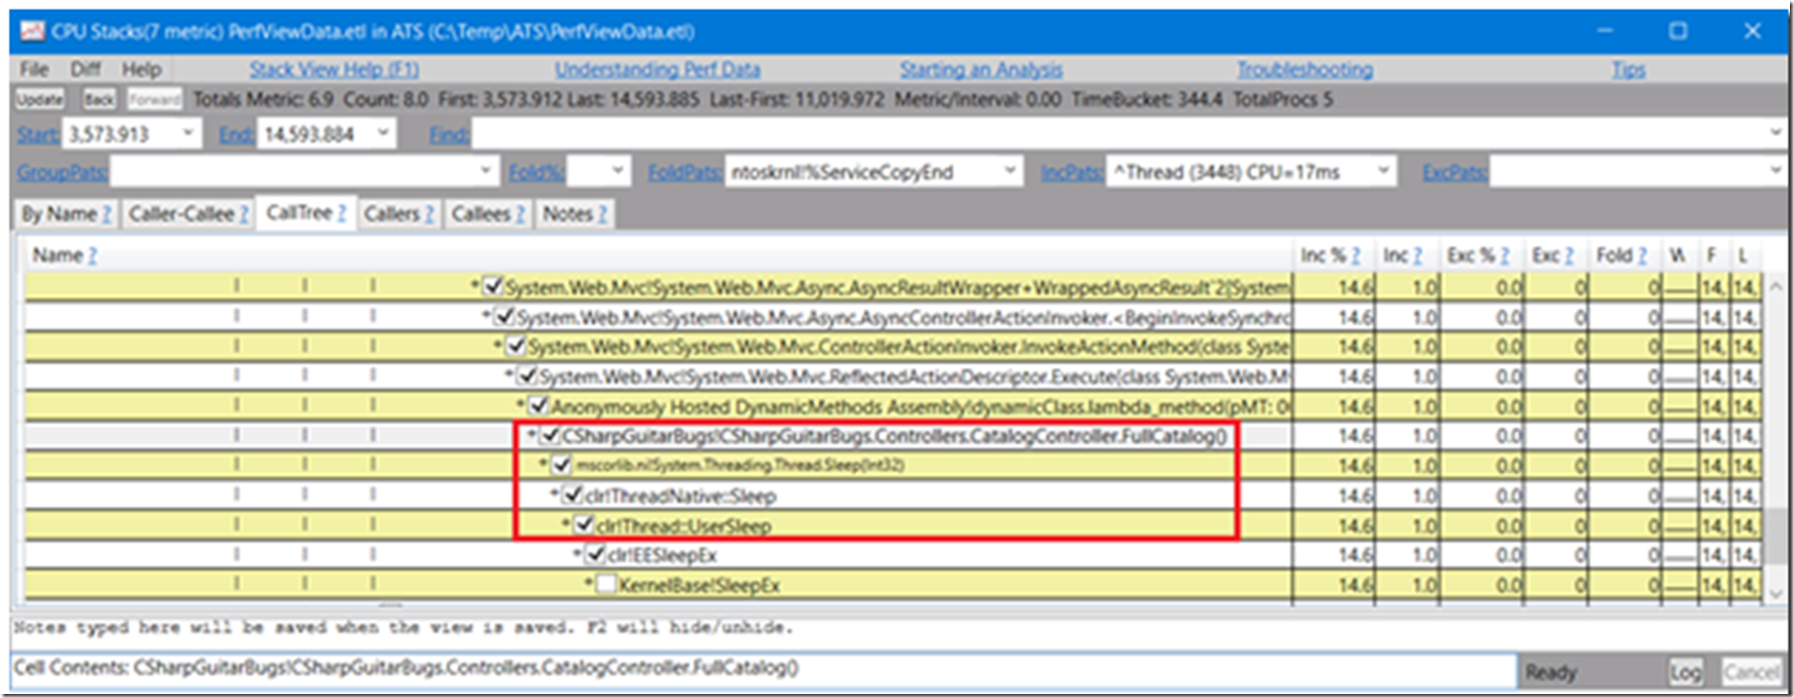
In a real world example, the analysis of this trace can take a very long time. In any case after making sure the symbols were loaded I looked around for what was happening during that trace. I found that there is a call to the Sleep() method in Controller for FullCatalog(), as shown in Figure 18.
Figure 18, why is an ASP.NET MVC request taking so long
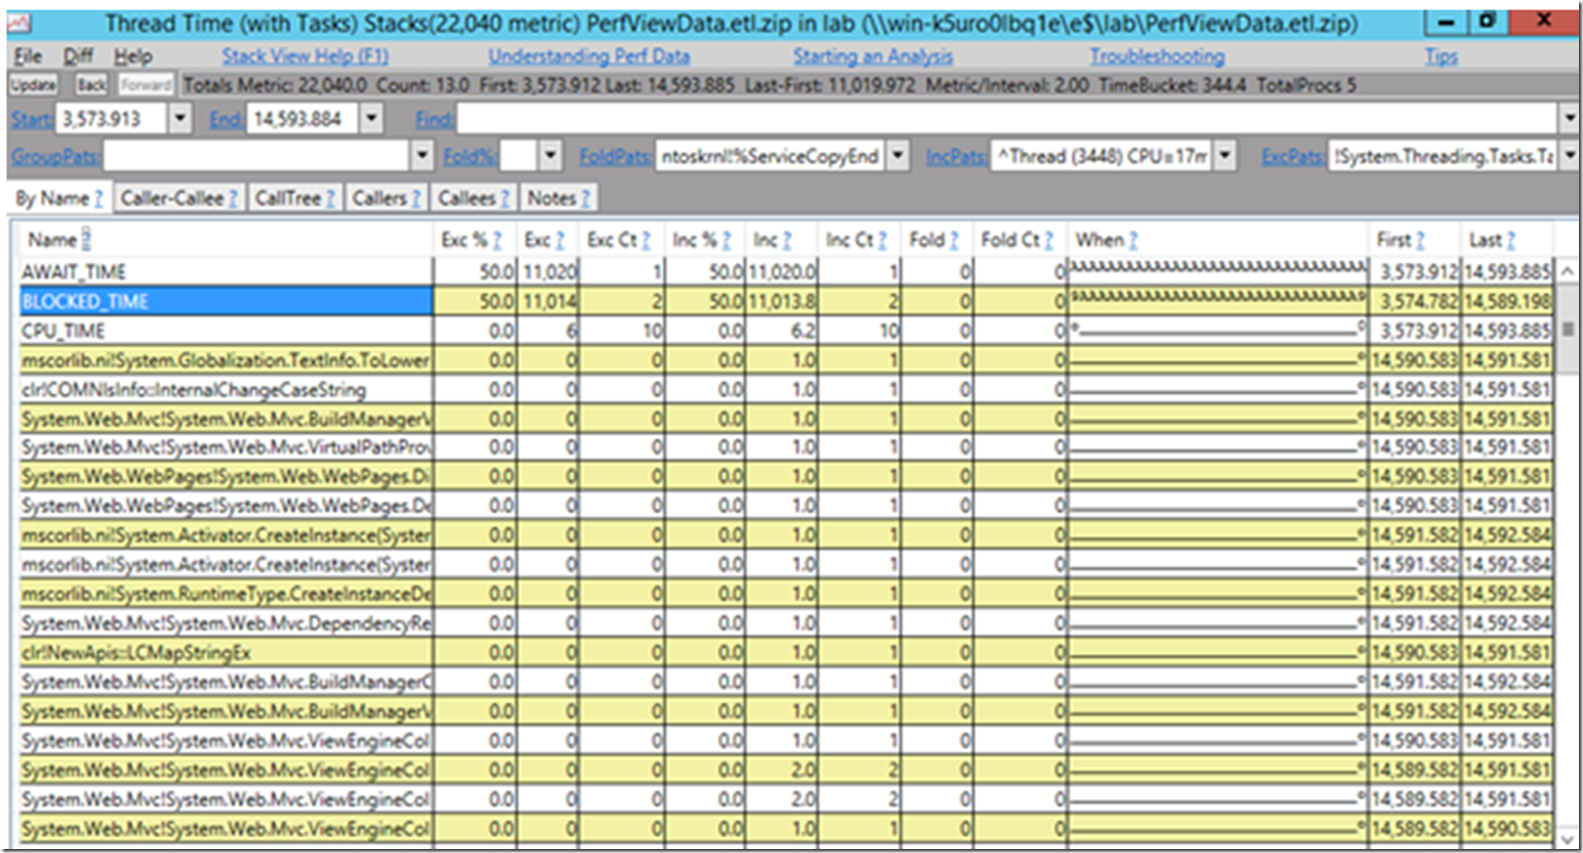
Additionally, in the video is mentioned to select Open CPU stacks from the window shown previously in Figure 17, you can alternatively select Open Thread Stacks, which renders the something similar to Figure 19 that shows AWAIT_TIME and BLOCKED_TIME.
Figure 19, ASP.NET MVC thread stacks
Double click on BLOCKED_TIME and a window similar to Figure 18 is rendered straight to the place where the Sleep() method is called which is the source of the slowness of the request.
I recommend that you capture a trace for any slow request you are troubleshooting just to see and learn how requests are managed on the server side, you can learn a massive amount by looking at these traces. Overtime you would perfect the analysis of the traces and the tool used to capture and analyze them.
ASP.NET MVC vs. ASP.NET pipeline
Figure 20, ASP.NET MVC vs ASP.NET request pipeline compared
