Setup
- Install Debugging Tools for Windows – For WinDbg
- Install and Configure CSharpGuitarBugs on an IIS server as described in Lab 1
- Place PROCDUMP executable on the IIS Server
- Review Memory Dump using PROCDUMP on 2008R2 or 2012R2:
Lab
- Open the CSharpGuitarBugs website
- Click on the ‘Enter Payment Information’ link and note about how long it takes. Notice also that there is limited CPU utilization.
- Open up 5 browser sessions and access the page, notice how long they take…notice that they each take about 5 seconds. Notice additionally that there is minimum CPU utilization.
Figure 1, Debugging a low CPU hang W3WP process using WinDbg
- What usually causes issues like this? Race conditions. Q: What is a race condition? A: A race condition happens when two or more threads can access a shared resource and they try to change it at the same time.
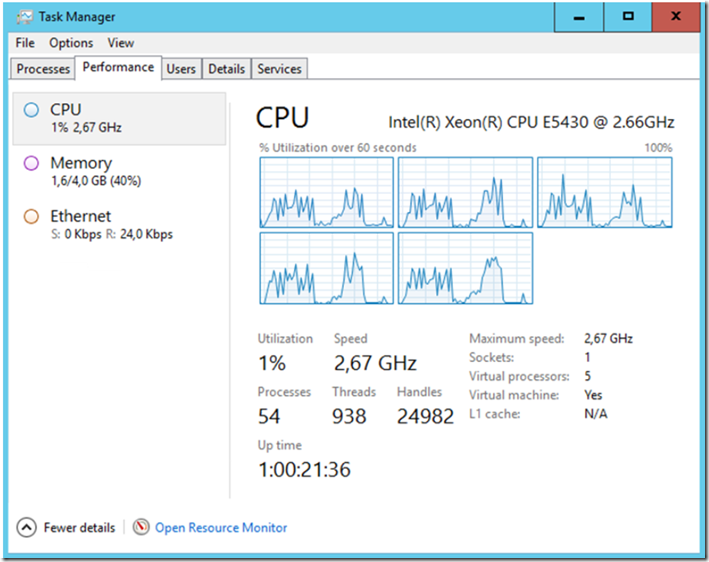
- Execute the following TINYGET commands to simulate load on the website and then capture the memory dump(s). Notice that there is limited CPU utilization.
Figure 2, Debugging a low CPU hang W3WP process using WinDbg
- Decide to setup a Failed Request Tracing rule (based on time-taken – Lab 16) to capture the dump or take a dump manually or with PROCDUMP.
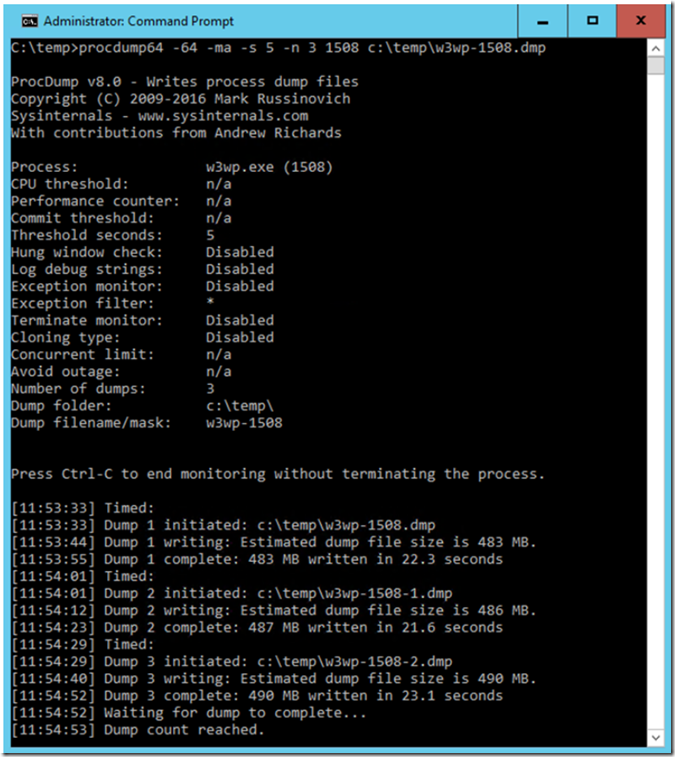
a. Consider the following PROCDUMP command which will captures a series of 3 memory dumps 5 seconds apart:
b. C:>procdump –64 –ma –s 5 –n 3 PID C:\temp\w3wp-PID.dmp
Figure 3, Debugging a low CPU hang W3WP process using WinDbg
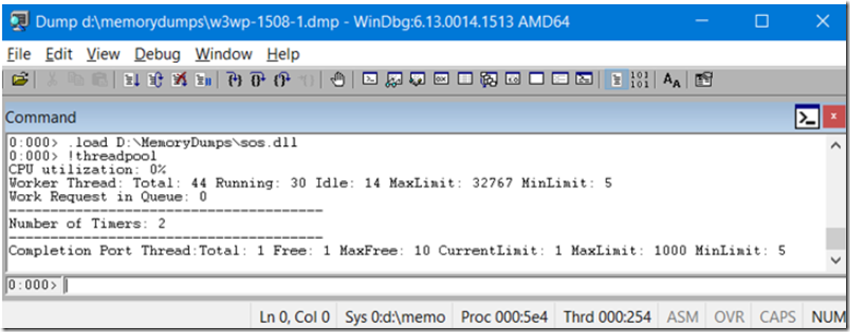
- Open the memory dump in WinDbg and load the SOS.dll version corresponding to the .NET version which the web site is running in. For example, the one I used was C:\Windows\Microsoft.NET\v4.0…\SOS.dll.
a. .load \sos.dll
b. !threadpool -> to check the CPU utilization…
Figure 4, Debugging a low CPU hang W3WP process using WinDbg
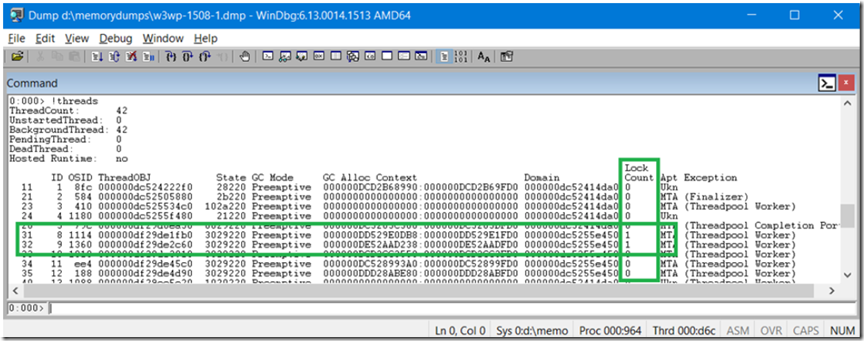
c. !threads ~50 threads. Q: is that a lot? A: It depends on the application, but in general I would not consider this a lot. It does look odd that there are ~50 threads running and there is no CPU consumption. Notice that the Lock Count shows that there are a number of locks, I.e. where Lock Count = 1. The locked threads are 31 and 32.
Figure 5, Debugging a low CPU hang W3WP process using WinDbg
d. ~* kb 2000 -> list all the native stacks, do you see any stacks that repeat, for example clr!AwareLock or clr!JITutil_MonContention
e. ~* e !clrstack -> list all the managed stacks, do you see any stacks the repeat, for example: System.Threading.Monitor.Enter(System.Object)? Think about what the problem is here or where the problem is happening.
I am seeing two patterns emerge, one istriggered from the OrderItem() method and the other from the EnterPaymentInformation() method.
Figure 6, Debugging a low CPU hang W3WP process using WinDbg
Figure 7, Debugging a low CPU hang W3WP process using WinDbg
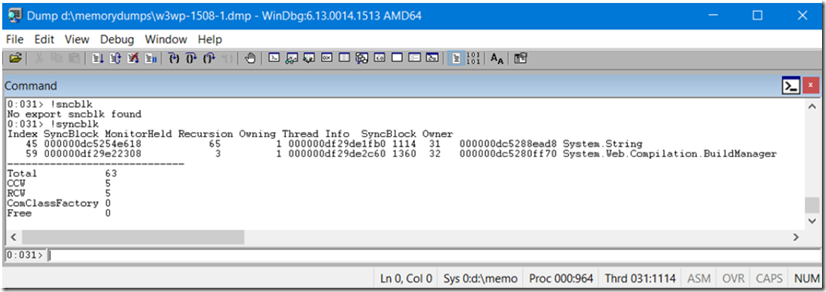
f. Enter !syncblk -> to list blocked threads and what they are waiting on, which thread is blocking?
Figure 8, Debugging a low CPU hang W3WP process using WinDbg
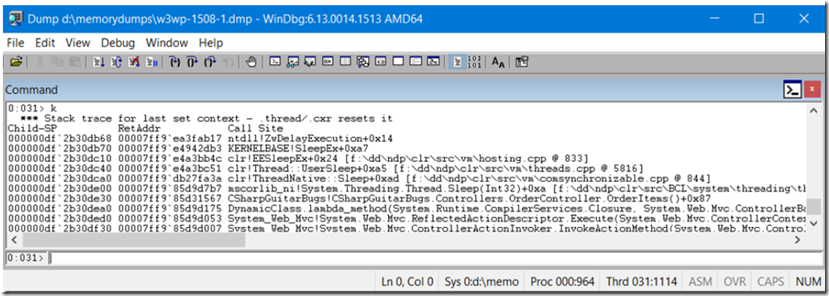
g. Change focus to the thread, ~31s and look at the stack, kb 2000. What is the thread doing?
Figure 9, Debugging a low CPU hang W3WP process using WinDbg
ntdll!ZwDelayExecution+0x14
KERNELBASE!SleepEx+0xa7
clr!EESleepEx+0x24 [f:\dd\ndp\clr\src\vm\hosting.cpp @ 833]
clr!Thread::UserSleep+0xa5 [f:\dd\ndp\clr\src\vm\threads.cpp @ 5816]clr!ThreadNative::Sleep+0xad [f:\dd\ndp\clr\src\vm\comsynchronizable.cpp @ 844]
mscorlib_ni!System.Threading.Thread.Sleep(Int32)+0xa [f:\dd\ndp\clr\src\BCL\system\threading\thread.cs @ 725]
CSharpGuitarBugs!CSharpGuitarBugs.Controllers.OrderController.OrderItems()+0x87
h. Execute !clrstack on the blocking thread, what do you see? You should/might see the Sleep()…maybe not depending on when the dump was taken…you should see it…
i. Either check what the OrderItems() method in the OrderCOntroller.cs file or !sam and open the DLL in Reflector to view the code and see what is happening.
