I like to write stuff. As I personally use it for reference, instead of keeping it to myself, I often post it onto my blog here. Here is my list of most used WinDbg commands and what information I get for them.
I was a big fan of PSSCOR, but since MEX is now a public WinDbg extension, the need for that is much less. I wrote about MEX here and it is a must have.
There is also a debug extension, SOS, which is provided with the each installation of the .NET Framework, I wrote how to find that on an Azure App Service here. The SOS.dll is installed into:
- 4.0, 32-bit –> C:\Windows\Microsoft.NET\Framework\v4.0.30319
- 4.0, 64-bit –> C:\Windows\Microsoft.NET\Framework64\v4.0.30319
So, here are the commands I always run when I perform analysis of a memory dump.
- !sos.threadpool
- !mex.us
- !mex.aspxpagesext
- !mex.mthreads / !sos.threads
- !mex.dae
- !sos.finalizequeue
- !mex.clrstack2
- !sos.savemodule
When a memory dump is first opened in WinDbg, there exists lots of information, for example:
The number of processes, the bitness and the version of Windows:
- Windows 8 Version 9200 MP (4 procs) Free x86 compatible
- Windows 8 Version 9200 MP (2 procs) Free x64
- Built by: 6.2.9200.16384 (*)
Getting started
What I usually do here is copy the SOS.DLL I have on my workstation: (this is important enough to mention twice, yes!)
- C:\Windows\Microsoft.NET\Framework64\v4.0.30319\
- C:\Windows\Microsoft.NET\Framework\v4.0.30319
or the one provided by the customer into the same directory of the memory dump. Then in the memory dump console I enter .load D:\path\sos.dll which loads the debug extension. Once the extension is loaded I can execute the extension methods.
Mex on the other hand, I place into the winext folder under the folder where the “Debugging Tools for Windows” is installed.
- C:\Program Files (x86)\Debugging Tools for Windows (x86)
- C:\Program Files\Debugging Tools for Windows
To see a list of methods enter the extension name then help. Ex: !sos.help or !mex.help
!sos.threadpool
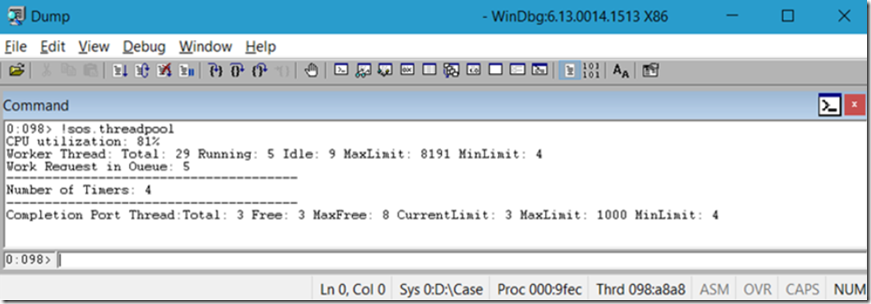
I run this command to see what the CPU consumption is on the machine which the process is running on. The output, Figure 1 does not mean the CPU consumption consumed by this process, rather the CPU consumption on the machine which the dump was taken from. You need to have checked in Task Manager to see which process is consuming the CPU and then take a dump of it. See here for how to do that.
Figure 1, must know WinDbg commands, my favorite: !sos.threadpool
*NOTE A special bit of information specifically seen in Figure 1 is that when Garbage Collection is running, the CPU is set to 81% so that no new ASP.NET threads get created. It is important that new threads are not created and changing the state of memory when GC is running, this makes sense. Just keep in mind, when you see 81%, it probably is not really 81%, instead GC is running and has set this value to suspend work so the clean up can happen.
!mex.us
Unique Stacks (us). Before the !us command existed I used ~*e k or ~*e sos.clrstack which would dump our all the stacks of all the threads running in the process. Then I would have to work through each one to see if I can pull out any patterns. What !mex.us does is it groups all stacks with the same pattern and groups them together. This makes it much easier to find patterns and the threads which may be causing the problems.
!mex.aspxpagesext
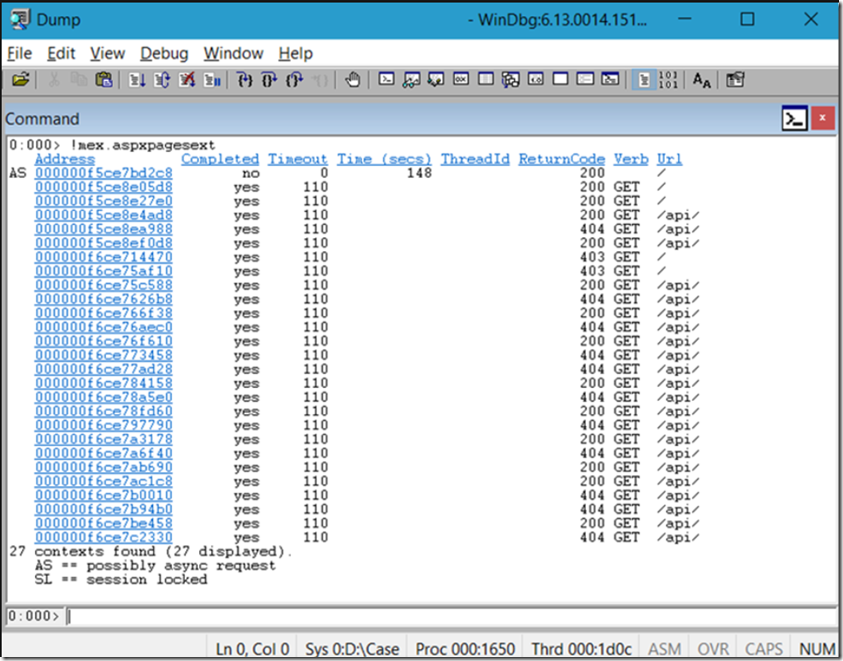
Executing this command will dump out a short history of ASPX pages which have run and currently running requests. With this command I can see what are the most common or currently running requests that are running when the memory dump was taken. This is helpful because many times, just knowing which requests are running can help developers focus in on those requests to see why they would be causing some kind of problem. Remember, that often users/clients simply escalate that the application is not running good, which is hard to troubleshoot. This command might lead the investigation to the page/request that is hanging, crashing or consuming too much CPU or memory.
The HTTP status code and the number of seconds in which the request has been running is also rendered.
*NOTE in Figure 2 that the address has a length of 16 digits, take a look at Figure 5, notice that there are only 8 digits that identify the address space. You can determine the bit-ness using those identifiers as well. 16 digits = 64 bit, 8 digits = 32 bit.
Figure 2, must know WinDbg commands, my favorite: !mex.aspxpagesext
!mex.mthreads / !sos.threads
Each one of the requests seen in Figure 2 is or was running on a thread. Also notice in Figure 2 that there is a ThreadId column, sometimes it is there, cannot say why it is not there in my example, it is hard to get a single dump that can explain all scenarios. This article contains examples from multiple dumps. If you are fortunate enough to get the ThreadId you can click on it and it would dump the stack running on the thread, The stack will show the methods running. This is what you want to find when debugging, I.e. the method that is running which you can then decompile and find out why.
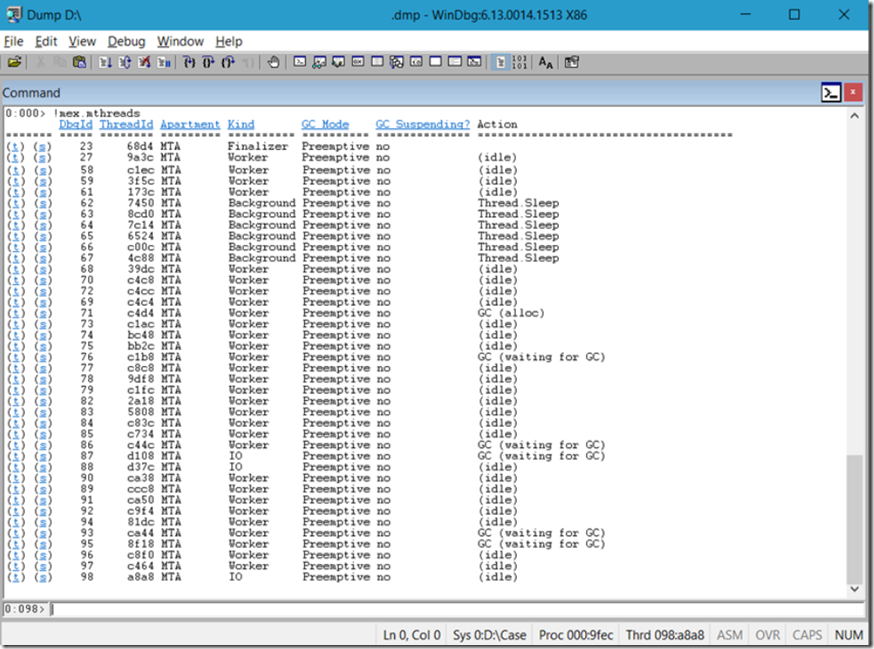
If you do not get the ThreadId then you can dump out all the threads, I recommend doing that anyway. In Figure 3, there exists the ThreadId and the DbgId. The DbgId is the one I use to set focus to for dumping the stack by using ~98s, for example, will notify the debugger to execute commands on thread 98.
I point out that the Action column, Figure 3 shows that some of the threads are calling Thread.Sleep and others are suspended “waiting for GC”. Recall from Figure 1, and that the CPU is at 81%, this is what is causing the 81% CPU consumption. (this shows only in the dump not on any performance counter, I expect)
GC Mode = Preemptive means that the thread will cooperate with the GC and allow it to be suspended regardless of where the execution is. I have seen notes that anything other than Preemptive mode is unsafe or at least unfriendly. It means that if I have coded a transaction that I want to finish without interruption of any kind and GC happens to run just then, it must wait until my thread is finished. Because GC suspends other threads, it can end up suspending longer than desired, especially if the thread throws an exception or gets hung. Then you would need to restart.
Figure 3, must know WinDbg commands, my favorite: !mex.mthreads / !sos.threads
!mex.dae
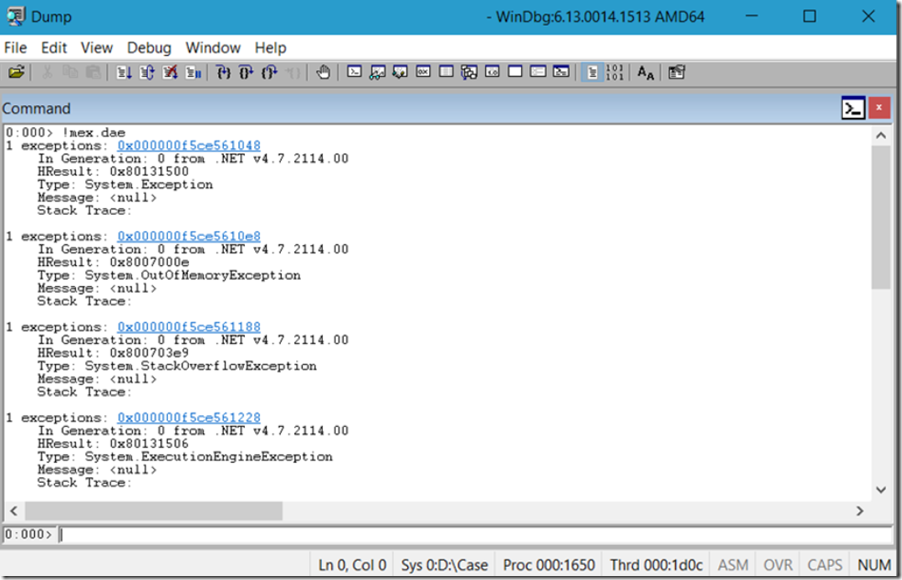
Dump All Exceptions (dae) is useful to see what kind of exceptions have happened over the previous short period of time within the process. Unhandled exceptions will crash the process so you won’t see them, you’d need to capture that using another method, described here. However, handled exceptions or those which happen within a try{}…catch{} and you can usually see them after executing !mex.dae.
It is important to note that although you see both System.OutOfMemoryException and System.StackOverflowException in Figure 4, it does not mean that those happened. Those are holders because if those exceptions happen, there is no place to put the information about the exception, and therefore they are instantiated in advance and ready for population if required.
Figure 4, must know WinDbg commands, my favorite: !mex.dae
If you wanted to drill into an exception, for example a System.Web.HttpException, System.Configuration.ConfigurationException or a System.Data.DataException then use !mex.PrintException2 or !sos.pe.
!sos.finalizequeue
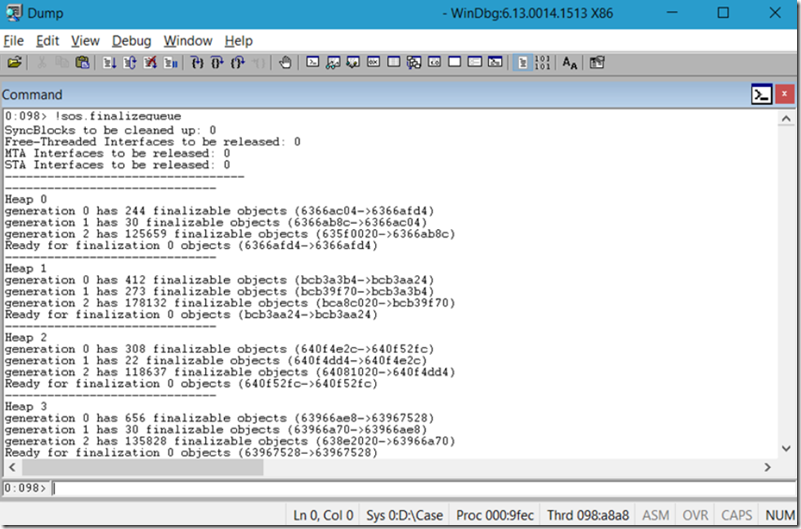
If I see that GC has been running or is running, like I see proof of in Figure 1 and Figure 3 I want to look at the finalize queue. I have stated a few times that the optimal allocation between the 3 generations of GC is 100-10-1. I.e. a ratio of 100 pinned objects in GEN0, 10 pinned objects in GEN1 and 1 pinned object in GEN2. As you can see in Figure 5, that the ratio is way off. It means that the code is keeping a handle on objects for multiple GC allocations and we know that the GC suspends execution so the more often and the longer it runs the more impact it has. And looking at Figure 5, it is at least running for a second or more as it has to check each object for roots each iteration to determine if the memory is still required. As there are so many, it might be causing some disruption.
Notice that there are 4 heaps. Heap 0, Heap 1, Heap 2 and Heap 3. Each processor on the machine has its own heap, you know the difference between a heap and stack and what variable types are stored into each? (*)
Also, GS Server or GC Workstation plays a role here.
Lastly, if the application can run within a 64 bit process, running in 64 bit can help remove some impact of GC.
Lastly, lastly, the GC process is good, the issue in Figure 5 is caused by holding onto objects in the custom code too long.
Figure 5, must know WinDbg commands, my favorite: !sos.finalizequeue
!mex.clrstack2
Once you identify the thread(s) which can be contributing to the issue, you can execute ~71s to change focus to the specific thread. In this case I am changing focus to thread # 71. Then I can dump out the CLR stack by using this command.
I show examples of !sos.clrstack in my IIS labs:
- Lab 19: Debugging a high CPU hang W3WP process using WinDbg
- Lab 20: Debugging a low CPU hang W3WP process using WinDbg
- Lab 21: Debugging a W3WP process with high memory consumption
This gives you more precise focus on the thread and the stack you think is causing the disruption
!sos.savemodule
I wrote how to execute SaveModule here. This is actually the most amazing thing ever.
!mex.runaway2 / !sos.runaway
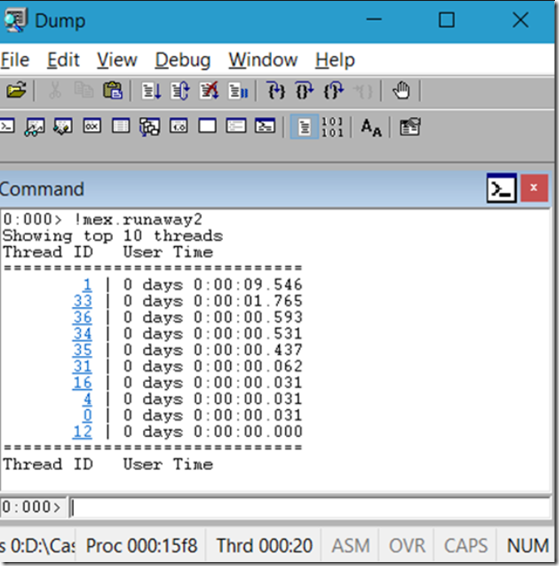
I wrote 2 articles about this one, although I am usually done at this point, if I execute the previous commands and still have not found a direction, then I run runaway for some possible additional clue.
Although in Figure 6 it shows that Thread ID = 1 has been running for 9 seconds, it does not always mean it is the one which is consuming the resources or causing the problem. You would need to change focus to thread 1, ~1s and then dump the stack. ~kb 2000 or !clrstack.
Figure 6, must know WinDbg commands, my favorite: !mex.runaway2 / !sos.runaway
Other useful commands
Here are some others which are good if you get stuck and need some additional input that might send you in a new direction
- !mex.cn – just make sure the memory dump was taken from the machine that was having the issue. Sometimes in a Web Farm environment it is hard to know which server is throwing the error, so you can use this part to see which server the dump was taken on. If you do not find anything, then it is probable that the issue is from another server. (computername)
- !mex.cordll – dumps out the version of the .NET CLR in/under which the managed code us running.
- !mex.ver – dumps out the version of the operating system on/in which the process was running
- !mex.sqlcn – if the application is making a database connection, execute this MEX command to check the state of the connections
- !mex.writemodule – creates assemblies loaded in the dump (!mex.writemodule -a -p <PATH>)
Now my list of must know commands is complete, I no longer need to shift around my OneNote or documents. It’s all right here. I hope this helps others. Rock!
