Things change and as I always say “that’s better than the alternative”. Although I have yet to put my finger on it, the behavior I experience when debugging Core applications is different than those which have come before. If I ever do figure out the specifics of those differences, I will write them down and share. Until then, here are some tips.
- Install and configure your debugging extensions and symbols
- Make sure you are in the correct WinDbg for the dump bitness
- Try to understand the scenario in which the dump was taken
- Execute Must use, must know WinDbg commands, my most used
Install and configure your debugging extensions and symbols
A first action you should take is to determine which extensions you already have loaded and what the configuration are. You can do this by entering .chain, the output might resemble the following.
0:000> .chain
Extension DLL search Path:
C:\Debugging\WinDbg x64\winext;…
Extension DLL chain:
dbghelp: image 6.13.0014.1513, API 6.2.6, built Thu Jun 28 02:14:16 2012
[path: C:\Debugging\WinDbg x64\dbghelp.dll]
…
ntsdexts: image 6.2.8441.0, API 1.0.0, built Thu Jun 28 02:14:49 2012
[path: C:\Debugging\WinDbg x64\WINXP\ntsdexts.dll]
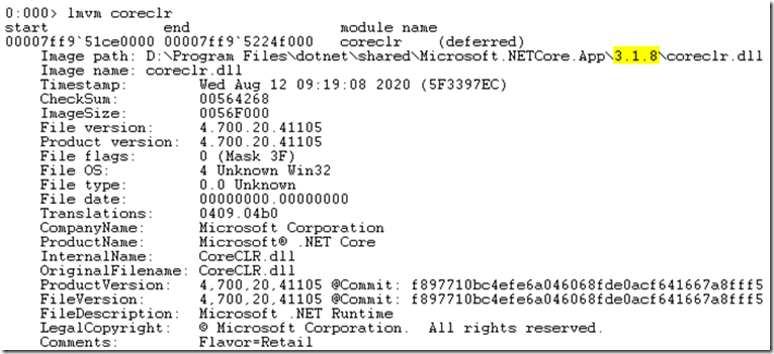
And as you can see there are not any extensions which would be helpful for debugging when the goal is an ASP.NET Core web application. So let’s figure out how to get them and the symbols. Enter lmvm coreclr to see which version of .NET Core you are running. Look for the value shown for the Image path, see Figure 1.
C:\Program Files\dotnet\shared\Microsoft.NETCore.App\3.1.8\coreclr.dll
Figure 1, how to tell which version of .NET your application is running
It used to be that the SOS.DLL would be present in that Image Path directory which allowed you to then load it, however this seems to have changes. Instead, now I find in that directory a file named SOS_README.md that directs to this URL. After some navigation and snooping around, I ultimately ended up here, which resulted in me installing SOS by using these two commands.
dotnet tool install -g dotnet-sos and dotnet-sos install, as seen in Figure 2.
The instructions then state that I needed to load the SOS.DLL into my Windows debugger. Note: I worked in the context of a 64 bit process and not in a 32 bit one. I did experience some issue when I tested, I didn’t proceed that further due to time and I didn’t need it right then, I’ll need to figure that one out later.
Figure 2, load SOS.DLL into WinDbg for .NET
I execute .chain again and did now find the SOS.DLL extension loaded.
Extension DLL chain:
C:\Users\benperk\.dotnet\sos\sos.dll: image 3.1.137102+c62ab0fb98a60d9c889b3db47d2a4e56d5c69321, API 2.0.0, built Wed Jul 22 05:09:27 2020
[path: C:\Users\benperk\.dotnet\sos\sos.dll]
Execute this command in WinDbg to load this SOS extension, *****replace the path*****.
.load C:\Users\benperk\.dotnet\sos\sos.dll
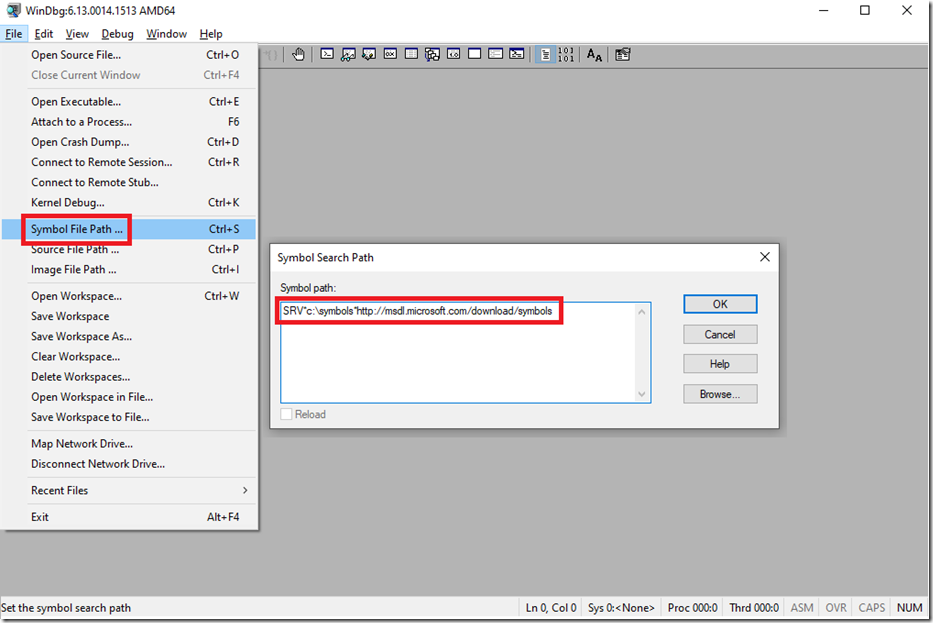
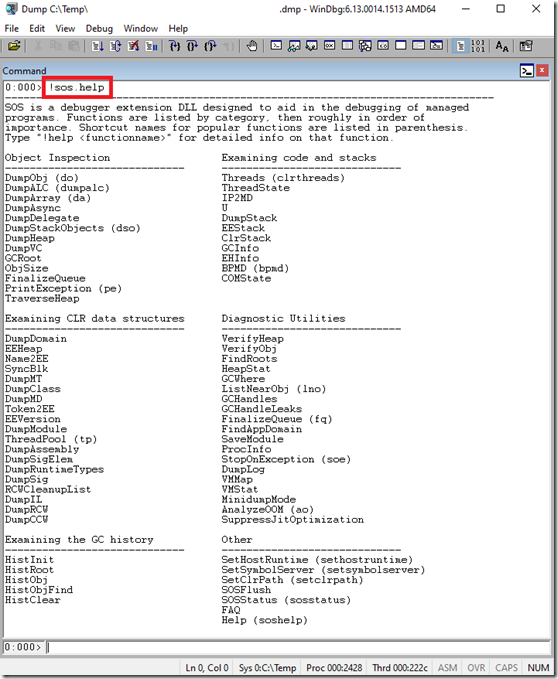
You can now enter !sos.help to see which debugging extensions you have at your disposal. See Figure 8 later. Just a note, the other very helpful debugging extension I use is called MEX. I wrote about it here. A public version of this can be downloaded from here. I used to really like PSSCOR2 or PSSCOR4, but I haven’t seen any support for them in a long time. In most scenarios MEX fills the gap. Next I needed to get the symbols configured. Since I do work at Microsoft there is an internal private symbol server, but because .NET Core is open source, there really isn’t anything private so the public symbol server path works just fine. The private symbols are geared more towards native code and proprietary software debugging, versus managed code. This is the Microsoft Symbol Server URL which you need to place into your debugger:
http://msdl.microsoft.com/download/symbols
In WinDbg it would look something like Figure 3.
Figure 3, load symbols into WinDbg for .NET Core
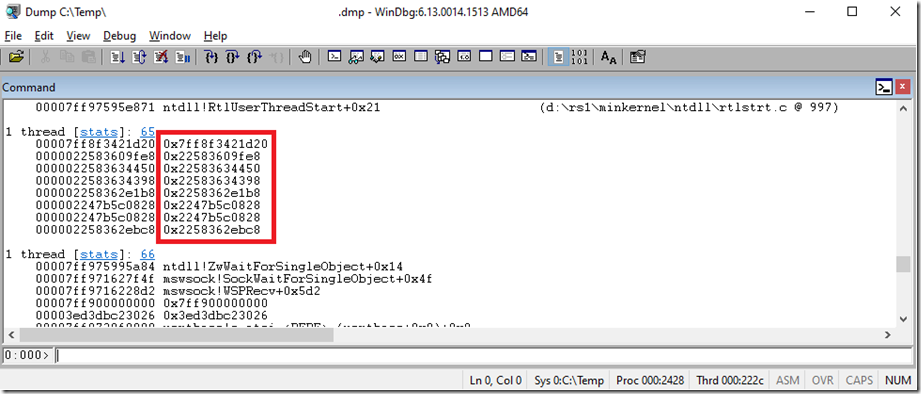
Without symbols the stacks on your threads will not resolve to a friendly, readable string and will instead look something like this, Figure 4.
Figure 4, load symbols into WinDbg for .NET Core, how stacks look without symbols
There is not a lot you can do with stacks that have no symbols. If the class, method and parameter names are present, which is the case when symbols are correctly used there is a lot you can derive from them. For example, if the name of a method on the top of the stack is called Sleep(), you can make a conclusion rather quickly about what is happening on that thread. But, with what you see below, you can conclude nothing. You might be able to use the address location to dump out what the value is and learn something about what’s happening in the process, but if you have 100 threads, it would take too long to work through them all.
1 thread [stats]: 65
00007ff8f3421d20 0x7ff8f3421d20
0000022583609fe8 0x22583609fe8
0000022583634450 0x22583634450
0000022583634398 0x22583634398
000002258362e1b8 0x2258362e1b8
000002247b5c0828 0x2247b5c0828
000002247b5c0828 0x2247b5c0828
000002258362ebc8 0x2258362ebc8
It’s not worth the effort and because there exists symbols, you should focus on getting them configured and working versus trying to make sense of the straight up hexadecimals.
Make sure you are in the correct WinDbg for the dump bitness
When you get a memory dump, perhaps one which you have not created or been involved in the creation of, one of the first actions is to determine if the bitness is 32 or 64 bit. This is important because there are two different versions of WinDbg, one for 32 bit and one for 64 bit. There is something called WOW64EXTS which will let you debug a 32 bit dump in the 64 bit WinDbg, so if you are stuck there, go for it, but you will be better off debugging with the expected WinDbg versions. When you open the memory dump you will see which bitness of the process.
32 bit
You will see the following in the WinDbg console. The x86 represents a 32 bit process, you can also see the number of CPUs/Cores and the version of Windows you are running on.
Windows 8 Version 14393 MP (4 procs) Free x86 compatible
Here is some random knowledge, not related to ASP.NET Core debugging, rather, just general computing knowledge. If execute the r command which dumps out the state of the register, you will notice that the memory addresses are 8 bits. See Figure 5.
Figure 5, 32 bit register
The numbers you see, for example 00bcf944 is a memory address of data or instructions which are being used by the CPU to perform its work. Address 7709ed0c is the register instruction pointer (rip) which is the piece of assembly code which is being executed at the time the memory dump was created. This is helpful in real-time debugging scenarios or scenarios which you capture the dump at the exact time of the exception you are trying to resolve.
64 bit
If the memory dumped process was a 64 bit one, you would see this line in the WinDbg console once opened. The x64 represents the bitness of the process.
Windows 8 Version 14393 MP (4 procs) Free x64
If you look at the memory addresses in Figure 6 and compare them to Figure 5, you will notice the addresses are 16 bits long instead of 8 bits. You can conclude that by having more digits to use for address space results in being able to have more memory available for the process. That is correct. 64 bit processes are without a doubt able to store much more data in memory when compared to a 32 bit process. The limitations of memory when running 32 bits is one of the reasons for the implementation of the 64 bit process model.
Figure 6, 64 bit register
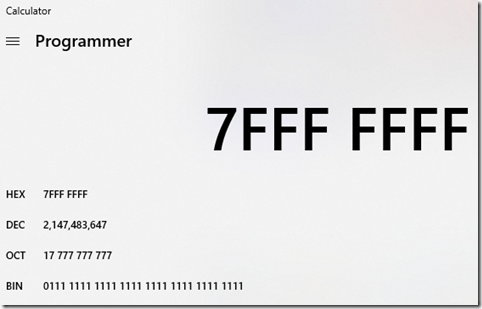
It was a ‘bit’ challenging (no pun intended) for me to comprehend why the memory addresses of a 32 bit process were 8 bits and for a 64 bit process the memory addresses were 16 bits. What I came to understand was that those are not bits, they are instead hexadecimal numbers that exclude the 0x in front of them. This was an important epiphany for me. I was searching for a way to get from those hexadecimal numbers (which I thought were bits) to match 4GB and 16EB by some factor of 2 (base-2), 4GB and 16EB are the maximum memory allowed for a 32bit and 64bit process respectively. Those values (4GB and 16EB) do map to 2 to the power of 32 which is 4GB and 2 to the power of 64, aka 16EB. The point is, and what I learned is that when we typically speak about 32 bit and 64 bit memory we are referring to virtual memory and not memory addresses. I must admit, this took me some time to finally get into my brain. I figured this out myself, nobody taught this to me or told me this directly. I think complicated concepts like this need to be learned and are not easily taught anyway. The memory limits have a lot to do with the operating system and the hardware on which the process runs. For a 32 bit process on Windows the virtual address space is limited to 2GB, can be increased to 3GB at bootup, but the address range is 0x00000000 through 0x7FFFFFFF which are 8 digit hexadecimal memory addresses. If you convert 0x7FFFFFFF to a decimal, you will find it to be 2,147,483,647 which is 2GB, see Figure 7. It makes sense that that if for a 32 bit process there are 2GB worth of addresses that 1 byte is stored at each address.
Figure 7, converting hexadecimal to decimal
For a 64 bit process the allocated virtual address space is a 16 digit hexadecimal value starting at 0x0000000000000000 and ending at 0x7FFFFFFFFFFFFFFF.
If you read an understand that, perhaps you better know why there are different versions of WinDbg for these two bitness types.
Try to understand the scenario in which the dump was taken
If you happen to get contacted to look at a memory dump, which happens often for me, it is important to get some context around it. I wrote some labs that describe those contexts, the context is important because they dictate which WinDbg commands to use and help with drawing conclusions from the output they render. The contexts are a Crash, a High CPU hang, a Low CPU hang and a Memory consumption problem.
- Lab 18: WinDbg – Crash
- Lab 19: WinDbg – High CPU Hang
- Lab 20: WinDbg – Low CPU Hang
- Lab 21: WinDbg – Memory consumption
Also, timing is everything. I have analyzed many memory dumps which were taken at a time before or after the issue was reproduced. Sometimes I spend some hours looking it over and find nothing, then learn the capture wasn’t taken at the correct time. Keep in mind that a memory dump is a snapshot of what was happening inside that process at the moment the dump is taken. If the crash, hang or memory issue is not happening when the dump is taken, you will not find it in the dump.
Execute Must use, must know WinDbg commands, my most used
In all honesty, I can execute 5 – 8 WinDbg commands and know almost immediately if any value will come from going forward with the analysis. What you see by simply looking at the method on top of the stacks on each thread typically is the issue. Or if it’s a memory issue, looking at what is filling up the heap the rooting it back to the method that instantiated it, will render the problem.
There are two WinDbg commands for taking a look at the stacks. I have also my list of all time favorite WinDbg methods documented here.
- ~*e !ClrStack
- !mex.us
It is always good to have a few options to get the same kind of information. While you will know from this article, !mex.us will bundle together threads with matching stacks. This will quickly identify an issue if you have 25 threads with the same stack. Simply look at the method at the top of the stack, review the code and see what going on in there. If for some reason that extension is not working you can fall back to ~*e !ClrStack. That is an SOS command which will dump out all the managed stacks on the threads but will not bundle them together. I used that one a lot before MEX existed. If you ever needed to dump out all the native stacks you can use ~*e kb 2000 for starters.
Figure 8 is the list of all the methods available in the SOS.DLL you get when running the dotnet-sos install tool.
Figure 8, SOS extension WinDbg command list
Here is the same from the output in Figure 8 in text form.
Object Inspection Examining code and stacks
—————————– —————————–
DumpObj (do) Threads (clrthreads)
DumpALC (dumpalc) ThreadState
DumpArray (da) IP2MD
DumpAsync U
DumpDelegate DumpStack
DumpStackObjects (dso) EEStack
DumpHeap ClrStack
DumpVC GCInfo
GCRoot EHInfo
ObjSize BPMD (bpmd)
FinalizeQueue COMState
PrintException (pe)
TraverseHeap
Examining CLR data structures Diagnostic Utilities
—————————– —————————–
DumpDomain VerifyHeap
EEHeap VerifyObj
Name2EE FindRoots
SyncBlk HeapStat
DumpMT GCWhere
DumpClass ListNearObj (lno)
DumpMD GCHandles
Token2EE GCHandleLeaks
EEVersion FinalizeQueue (fq)
DumpModule FindAppDomain
ThreadPool (tp) SaveModule
DumpAssembly ProcInfo
DumpSigElem StopOnException (soe)
DumpRuntimeTypes DumpLog
DumpSig VMMap
RCWCleanupList VMStat
DumpIL MinidumpMode
DumpRCW AnalyzeOOM (ao)
DumpCCW SuppressJitOptimization
Examining the GC history Other
—————————– —————————–
HistInit SetHostRuntime (sethostruntime)
HistRoot SetSymbolServer (setsymbolserver)
HistObj SetClrPath (setclrpath)
HistObjFind SOSFlush
HistClear SOSStatus (sosstatus)
FAQ
Help (soshelp)
I hope you found this one helpful. Let me know on LinkedIn or GitHub if you did.
